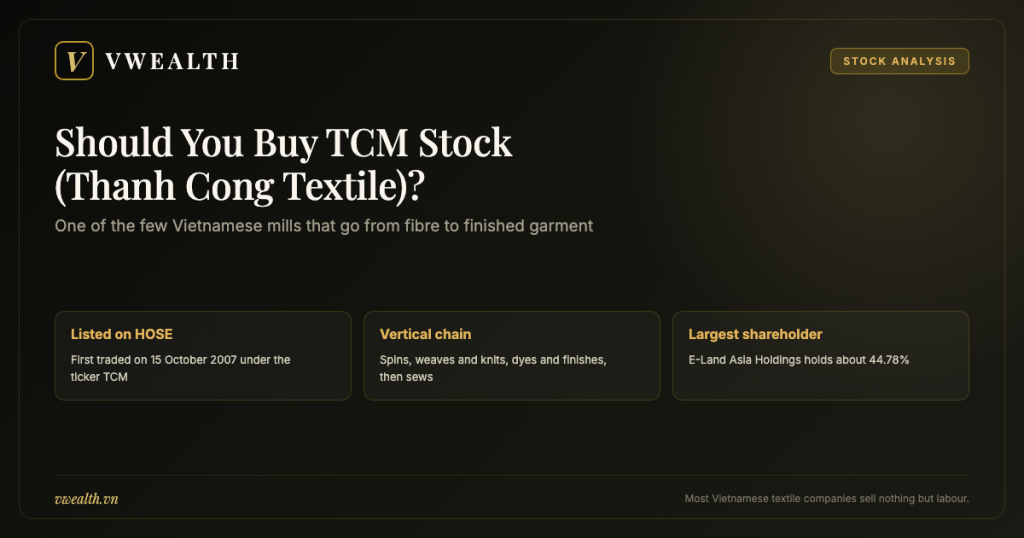
Should you buy TCM stock, the ticker of Thanh Cong Textile Garment Investment Trading Joint Stock Company on Vietnam’s Ho Chi Minh Stock Exchange? You cannot answer that question without first understanding one thing about Vietnamese textiles: the overwhelming majority of companies in this industry perform exactly one step, which is sewing. They receive fabric from a foreign buyer, cut it, sew it, pack it and ship it back, and they collect a thin assembly fee for the labour. Thanh Cong is different. It spins yarn, weaves and knits fabric, dyes and finishes that fabric, and only then sews. All four stages sit inside the same group. That vertical chain is rare enough that only a handful of Vietnamese companies possess it, and it is the single reason TCM deserves its own analysis rather than being filed with the assembly houses. This article explains why vertical integration matters so much in this particular industry, what it costs to maintain, and finally whether that chain is enough to make TCM a good investment.
Before we begin, a convention between you and this article, the same one every company analysis in this series follows. You will meet dates, names, plant locations, capacity figures and ownership data, all drawn from public sources: corporate filings, exchange disclosures, the company’s own published information and mainstream financial press. What you will not meet is last quarter’s earnings, today’s share price or a current valuation multiple. For an exporter with seasonal order flow and thin margins, a monthly or quarterly profit figure stripped of its seasonal context will lead you to the wrong conclusion. Instead this article teaches you where to look and how to read it; for the numbers, open the latest research reports on vwealth.
A second convention: this is the first article in the series covering the textile and garment industry, so it stops to explain the basic mechanics where necessary. If you already know the industry, skim those passages. But if you intend to invest in Vietnamese textiles without being able to distinguish pure assembly work from a full-package model, those are precisely the passages worth reading, because that distinction determines the margin of the entire sector.
One more piece of scaffolding for readers new to this market. Vietnamese equities trade on HOSE, where TCM is listed, on the Hanoi exchange, and on UPCoM. Settlement is T plus two, HOSE applies a daily price band of seven per cent either side of the reference price, and foreign ownership is capped by sector and by company charter. A tour of the mechanics is in the guide on how to invest in the Vietnam stock market.
From a Saigon weaving mill in 1967 to a rare vertically integrated chain
Vietnam has thousands of textile and garment companies, but the number that can go from fibre to finished product can be counted on one hand. Thanh Cong’s history explains why it belongs to that small group, and why the position cannot be copied quickly.
1967: beginnings in weaving
The company’s predecessor was a textile engineering firm founded in Saigon in 1967. The detail to notice immediately is the original trade: this business started in weaving, that is in fabric production, not in sewing.
That detail matters far more than it appears. In this industry, a company that starts in sewing finds it extremely hard to move upstream into fabric, because weaving and dyeing demand heavy capital, wastewater treatment infrastructure and an entirely different technical skill base. A company that starts in fabric, by contrast, finds moving downstream into sewing a relatively easy extension, because sewing is labour-intensive rather than technology-intensive.
Thanh Cong moved in the easy direction. That is why it possesses a vertical chain while thousands of Vietnamese garment companies do not, including many with larger revenue.
It is worth being precise about what “rare” means here, because the claim carries the whole argument. Vietnam has a very large number of registered textile and garment enterprises, and a substantial number of spinning mills, since spinning was one of the earliest stages the country industrialised. What is scarce is the combination: spinning plus weaving or knitting plus dyeing and finishing plus sewing, under one owner, at commercial scale, with the dyeing stage legally licensed and environmentally compliant. Remove any one of those conditions and the chain does not deliver the benefits described in this chapter.
The dyeing stage is the binding constraint, which is why chapter one gave it a section of its own. A company can buy spinning machinery or add sewing lines within a year. It cannot conjure a dyeing licence in a province that is not issuing them, and it cannot operate one without the treatment infrastructure and the technical staff to run it continuously.
That is why the correct mental model for this company is not “a garment maker with extra factories” but “a fabric business that also sews”. The fabric capability is the scarce asset; the sewing capacity is the means of converting it into a finished, higher-value product. If you hold that model in mind, the rest of the analysis follows naturally, including why margin and bargaining power differ from the rest of the sector and why operating leverage runs the way it does.
From private mill to state enterprise and back to a joint stock company
Like many manufacturers in southern Vietnam founded before 1975, Thanh Cong spent a period operating as a state enterprise before converting to a joint stock company in 2006.
That state period left two legacies worth noting. The first is land and factory sites in and around Ho Chi Minh City, allocated decades ago when land was cheap and zoning was permissive. The second is a base of dyeing and weaving equipment installed across successive investment rounds, together with a technical workforce whose skills accumulated over time.
The flip side must be stated plainly too. Plants inside a rapidly urbanising area face environmental scrutiny and rising labour costs, and they are hard to expand. That is why the company’s expansion over the past two decades has moved toward the provinces: Tay Ninh for spinning and sewing, Vinh Long for sewing.
15 October 2007: listing on HOSE
TCM shares began trading on the Ho Chi Minh Stock Exchange on 15 October 2007.
That was the peak of a euphoric cycle in Vietnamese equities, immediately before the global financial crisis arrived. A company that lists at a cycle peak usually needs years before investors stop anchoring on the price of the initial offering, and that is part of the market’s collective memory of this ticker.
More important for you today is that listing opened the door to a foreign strategic investor. And that investor changed the company.
E-Land arrives: when the customer becomes the owner
The largest turning point in Thanh Cong’s modern history is that E-Land Asia Holdings, a Singapore-registered entity within South Korea’s E-Land group, became the largest shareholder with roughly forty-four point seven eight per cent.
You need to know who E-Land is to judge this relationship properly. It is a South Korean group operating in fashion and retail, owning multiple brands and distribution networks. Which means Thanh Cong’s largest shareholder is not a financial fund seeking a capital gain but an operating company in the same industry, positioned at the final point of consumption.
This is a structure whose two sides both deserve weight.
The favourable side: a strategic shareholder that is a fashion retailer brings a stable base of orders, brings knowledge of end-market taste, and brings the operating discipline of an international supply chain. Every contract manufacturer fears losing a major customer above all else; when the customer is also the owner, that risk falls sharply.
The unfavourable side: when the customer is also the owner, transfer pricing becomes a live question. Transactions between the company and related parties within the same group need careful reading, because the pricing in those transactions flows directly into the margin of the listed entity where you are a minority shareholder. This is not an allegation about anyone; it is a general principle for reading any company whose largest shareholder is also a commercial counterparty. Read the related party note in the financial statements, and compare revenue from related parties against total revenue. Broader context on governance norms in this market is in Vietnam corporate governance.
There is a further dimension of the strategic shareholder relationship that investors should weigh, and it is rarely discussed. When a meaningful share of orders comes from the largest shareholder’s ecosystem, the company has a stable revenue base, but it also has less incentive to build independent selling capability. The business development team of a company that always has orders tends to be weaker than that of a company which must find them.
That is a long-term risk rather than a next-quarter risk. It surfaces only if the strategic shareholder’s own ecosystem runs into difficulty, or if its strategy changes. The way to monitor it is to track the share of revenue from customers outside the related party group across several years: a rising share is evidence the company is standing on its own.
In fairness to the model, being inside a large retail brand’s supply chain in this industry is not simply a matter of receiving orders. It also means meeting and maintaining that brand’s standards on quality, labour conditions, environmental performance and traceability. Those standards cost money to satisfy, but once achieved they become a passport to other brands of the same tier.
Expanding into the provinces: Trang Bang and Vinh Long
The current plant portfolio spans several locations, and the distribution follows the logic of the industry.
Headquarters and principal plants are in Ho Chi Minh City. Knitting is located in the Nhi Xuan industrial park in Hoc Mon district. Spinning has facilities in District 4 and in the Trang Bang industrial park in Tay Ninh. Sewing has plants in the Hoa Phu industrial park in Vinh Long and in Trang Bang.
The logic runs as follows: the most labour-intensive stage, sewing, is pushed out to the provinces where labour is cheaper and more abundant. The capital and technology-intensive stages, weaving and dyeing, stay closer to the centre where infrastructure and technical staff are available.
On scale, the production chain carries spinning capacity of roughly ten thousand tonnes per year, woven fabric of roughly nine point six million metres per year, knitted fabric of roughly fifteen thousand tonnes per year, dyeing and finishing of roughly ten million metres of woven fabric and eight thousand four hundred tonnes of knitted fabric per year, and sewing of roughly twenty-six million garments per year. Products are exported to more than forty countries.
Why dyeing is the bottleneck of the entire industry
To understand Thanh Cong’s position you need to understand why Vietnam has thousands of sewing plants but very few dyeing mills. It is not a shortage of capital.
Dyeing consumes water in large volumes and discharges wastewater containing dyestuffs, processing chemicals, salts and heavy metals at high concentration. Treating that effluent requires a multi-stage system, heavy capital investment and continuous operating cost. A properly run dyeing mill must operate its treatment plant at all times, including when order volumes are low.
For that reason many Vietnamese provinces are cautious about licensing new dyeing projects, and some effectively decline them. The result is that domestic dyeing capacity has grown far more slowly than sewing capacity, creating a bottleneck in the middle of the value chain.
For an investor that bottleneck has a double meaning. It explains why Vietnam still imports a large share of the fabric used for export garments, which is to say why much of the industry’s value added does not stay in the country. And it explains why an operating dyeing licence is an asset with genuine economic value, no less than a production line.
This is the kind of barrier that investors trained on technology analysis tend to miss, because it lives not in patents or trade secrets but in administrative files. Yet an administrative barrier is sometimes more durable than a technological one, because technology can be bought and a licence cannot.
There is a second-order effect worth noting. As global brands tighten their environmental requirements, the cost of operating a compliant dyeing mill rises further, which raises the barrier again. A company that has already built and financed that infrastructure sees its relative position improve each time standards tighten, while a competitor contemplating entry sees the required investment grow.
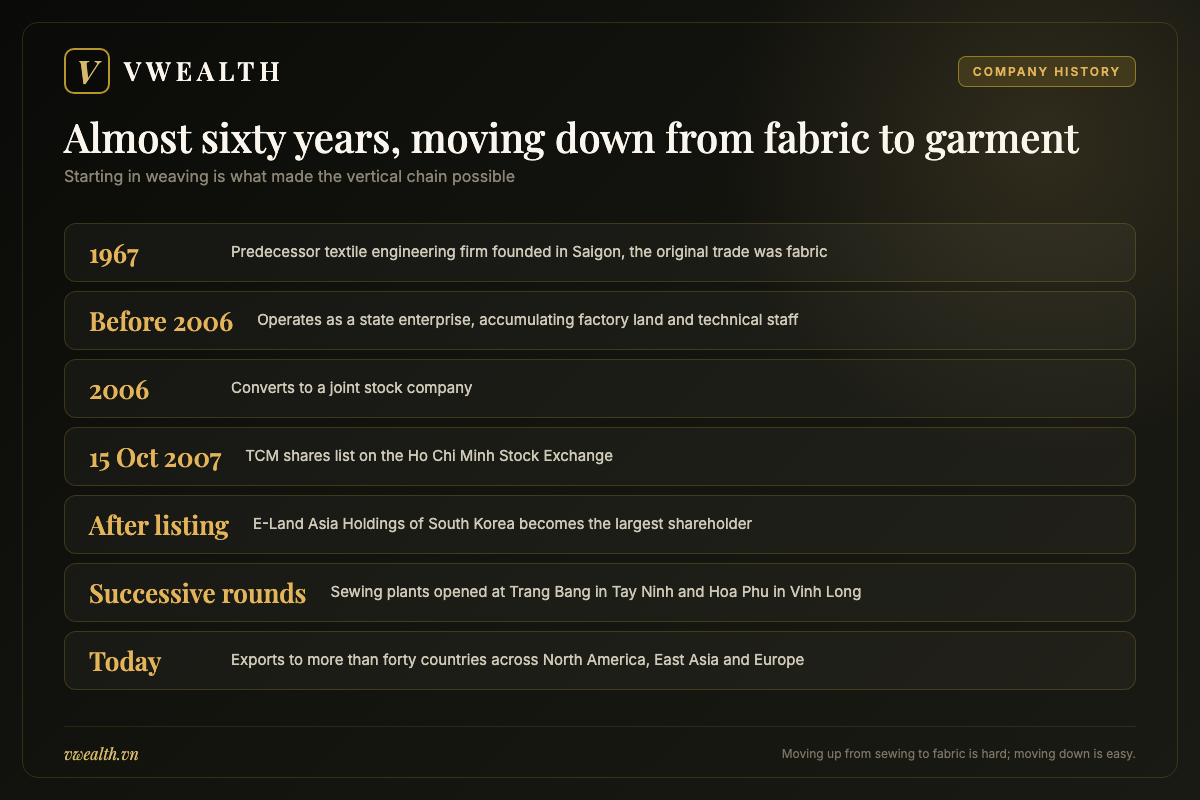
| Date | Event | What it means for an investor |
|---|---|---|
| 1967 | Predecessor textile engineering firm founded in Saigon | Starting in fabric made moving down into sewing far easier |
| Before 2006 | Operates as a state enterprise | Leaves behind factory land and a dyeing and weaving skill base |
| 2006 | Converts to a joint stock company | Opens the route to capital markets and a strategic investor |
| 15 Oct 2007 | TCM shares list on HOSE | Listed at a cycle peak, part of the market’s memory of this ticker |
| After listing | E-Land Asia Holdings becomes the largest shareholder | The customer becomes the owner: a support and a thing to scrutinise |
| Successive rounds | Sewing plants opened in Trang Bang, Tay Ninh and Hoa Phu, Vinh Long | Labour-intensive stages moved to lower-cost provinces |
A Korean shareholder and a two-nationality leadership team
Thanh Cong’s governance structure is one of the more distinctive on the Vietnamese exchange, and it says a good deal about how the company operates.
The ownership map
According to published ownership data, the company has roughly one hundred and seventeen million six hundred thousand shares outstanding. The largest shareholder is E-Land Asia Holdings at roughly forty-four point seven eight per cent. Next is a domestic individual shareholder at roughly eight point five one per cent, followed by several domestic institutions with smaller stakes.
Three features of that picture matter.
The first: the controlling shareholder is foreign but does not hold a majority. Below fifty per cent, E-Land has decisive practical influence but still requires support on matters demanding a higher voting threshold.
The second: TCM’s free float is considerably larger than at companies where a state body or a family holds an outright majority. That is a genuine positive for liquidity.
The third: there is a domestic individual shareholder large enough to hold a board seat. In July 2026, a disclosure appeared regarding a block of TCM shares held by this board member being force-sold by a securities company. Understand what that means: a forced sale occurs when shares pledged as collateral for a margin loan fall below the required maintenance level and the broker sells to recover the loan. It is a technical consequence of leverage, not a verdict on the company’s operations.
It is nonetheless worth tracking, for two reasons. First, forced selling of insider-held stock creates unexpected supply in the market. Second, it shows that insider ownership levels can move, so you should read the latest disclosure rather than trusting any fixed number.
Leadership: Vietnamese and Korean side by side
Thanh Cong’s board is chaired by Mr Tran Nhu Tung. The vice chairman is Mr Park Heung Su. The general director is Mr Song Jae Ho. The board also includes other Vietnamese and Korean members together with an independent director.
A Vietnamese chairman with a foreign chief executive is an uncommon arrangement on this exchange, and it has practical logic. The Vietnamese chairman handles relations with domestic regulators, with provincial authorities, with the workforce and with domestic investors. The Korean chief executive connects directly to the strategic shareholder and to the operating standards of the international fashion supply chain.
What you should track is not anyone’s nationality but three questions. Is the company expanding its customer base beyond the strategic shareholder’s ecosystem? Is it raising the share of orders in higher value-added models? And is disclosure quality being maintained?
Foreign ownership room: an important technical point
Because the largest shareholder is a foreign institution holding close to forty-five per cent, the remaining foreign ownership headroom in TCM is far narrower than at a typical Vietnamese manufacturer.
This has two consequences. For a foreign investor, additional purchases may be constrained by the remaining room, and in periods when the room is close to full, foreign buy orders simply cannot be filled. For domestic investors, a narrow room reduces the chance of the stock benefiting from waves of foreign inflows. The mechanics of these caps and how to check remaining headroom are explained in foreign room in Vietnam stocks.
Dividends
Thanh Cong belongs to the group of Vietnamese manufacturers that maintain a dividend, which distinguishes it from many smaller textile names that retain all earnings to fund working capital.
The capacity to pay comes from the model itself: a vertical chain earns a better margin than pure assembly, so after funding working capital there is something left. But check the actual payout in the most recent period against profit rather than relying on a rate announced earlier, because investment in new capacity can change the policy. A survey of income alternatives in this market is in Vietnam dividend stocks.
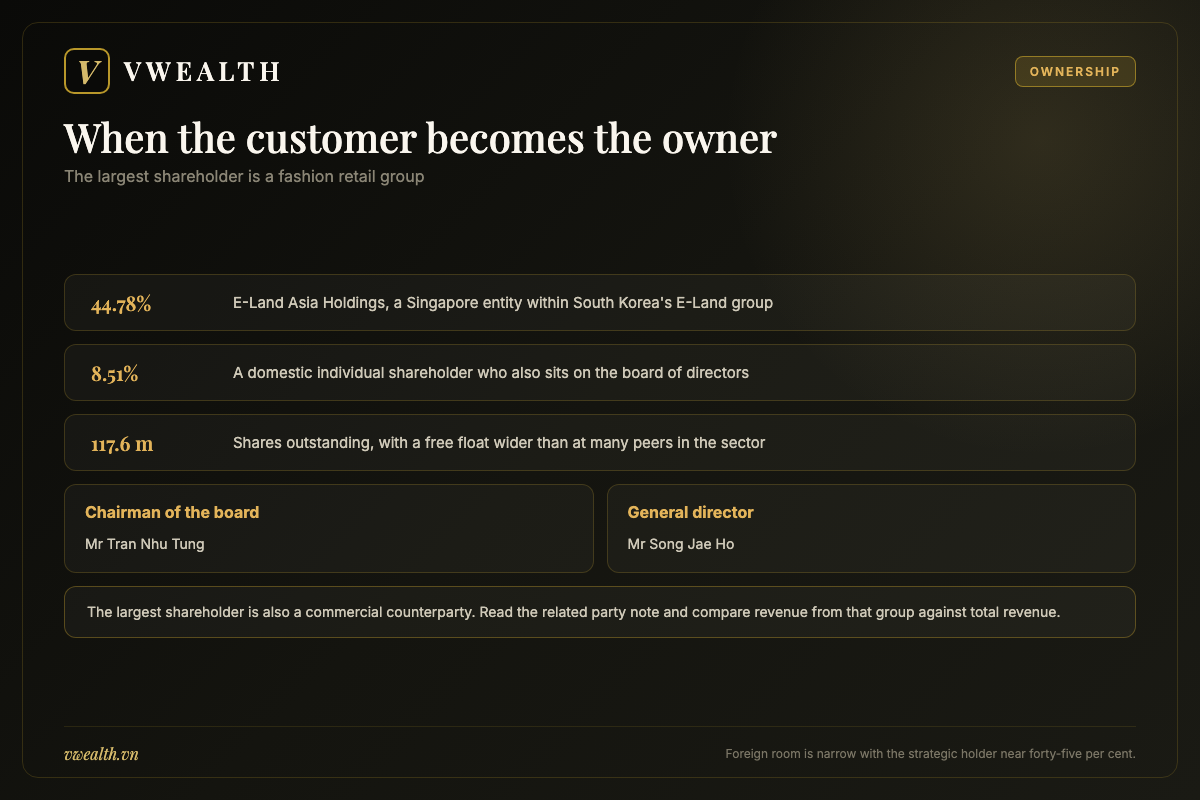
| Item | Disclosed status | What to keep monitoring |
|---|---|---|
| Shares outstanding | Approximately 117.6 million | Changes from employee issuance or stock dividends |
| Largest shareholder | E-Land Asia Holdings, about 44.78% | Share of orders coming from the related party group |
| Large individual holder | A board member with about 8.51% | Ownership changes after the July 2026 forced sale |
| Chairman of the board | Mr Tran Nhu Tung | Strategy for widening the customer base |
| General director | Mr Song Jae Ho | Operating efficiency of the vertical chain |
| Foreign ownership room | Narrow, with the strategic holder near 45% | Whether foreign buyers can add on inflows |
| Dividend | Maintained, unlike many smaller textile names | Capital pressure from new plant investment |
How Thanh Cong makes money: four stages and three business models
This is the most important chapter of the analysis. If you understand it, you will be able to assess any Vietnamese textile company, not only this one.
Three business models: CMT, FOB and ODM
Before discussing Thanh Cong, we need the three business models of export garment manufacturing, because they determine margin more than any other factor.
The first is pure assembly, known in the trade as CMT, short for cut, make and trim. The foreign buyer ships fabric, trims and a technical design; the Vietnamese company cuts, sews, packs and collects a conversion fee. It commits no capital to materials, so risk is low, but margins are very thin, typically a low single-digit percentage. This is the dominant model in Vietnam.
The second is the full-package model, universally called FOB in this industry. The buyer supplies the design and technical specification; the manufacturer sources or produces the fabric and trims itself, manufactures, and sells the finished garment. It requires far more working capital and carries raw material price risk, but the margin is materially better because the material value also earns a mark-up.
The third is original design manufacturing, or ODM. The manufacturer develops its own designs, the buyer selects from them, and the manufacturer produces and ships. This carries the highest margin of the three, because it sells design capability rather than only labour.
This is the most important yardstick when comparing two textile companies: not revenue, not headcount, but the mix of orders across these three models. A company with modest revenue mostly in FOB and ODM will out-earn a company with far larger revenue entirely in CMT.
The vertical chain and why it changes everything
Thanh Cong operates all four stages: spinning, weaving and knitting, dyeing and finishing, and sewing. The significance has four parts.
The first is margin. Each stage adds a layer of value. A company that only sews captures only the sewing layer; a company that runs the whole chain captures all four. That is the mechanical reason an integrated producer earns more.
The second is the ability to run FOB and ODM at all. To do full-package work, the manufacturer must control fabric. Buying fabric on the open market means accepting price risk, lead time risk and batch-to-batch quality variation. A company that weaves and dyes its own fabric controls all three. Vertical integration is not merely additive profit; it is the precondition for stepping into the higher-margin models.
The third is speed. Fashion product cycles keep shortening, and buyers want a matter of weeks from design freeze to delivery. A manufacturer importing fabric loses several weeks to shipping alone. A manufacturer with fabric on site compresses lead time materially, and lead time is becoming as important a selection criterion as price.
The fourth, and the most consequential in policy terms, is rules of origin. That deserves its own section.
Rules of origin: why trade agreements favour integrated producers
This is the point outside investors most often miss, and it underpins the whole investment case for integrated textile names.
The new-generation free trade agreements Vietnam has joined all impose origin conditions before goods qualify for preferential tariff treatment. For textiles those conditions usually take one of two forms. The first requires yarn forward, meaning the yarn must be produced within the bloc, and weaving, dyeing and sewing must also occur within the bloc. The second requires fabric forward, meaning the fabric must originate within the bloc.
Consider the implication. A pure assembly house importing fabric from outside the bloc produces goods that fail the origin test, so its buyer cannot claim the preferential rate on import. A company that spins, weaves and dyes in Vietnam satisfies even the strictest formulation.
In other words, free trade agreements do not distribute their benefits evenly across Vietnam’s textile industry. They distribute them to the very small group of companies with an integrated chain. That is Thanh Cong’s moat, and it is a moat created by policy rather than by technology.
Every moat has conditions of existence, though. This one depends on the agreements retaining their origin rules, and on the gap between preferential and standard tariff rates being wide enough for buyers to care. If a large market applies a uniform tariff to all goods from Vietnam regardless of material origin, the advantage of the integrated chain is partly neutralised in that market. That is a real risk, discussed in chapter six.
There is a further practical caveat. The benefit of an agreement does not arrive automatically or evenly. It depends on three things: the size of the gap between preferential and standard rates in the destination market; the manufacturer’s ability to document origin; and whether the importing customer actually bothers to claim the preference. Many smaller importers do not, because the compliance cost exceeds the benefit. So when a textile company says it benefits from a trade agreement, ask the follow-up: what share of revenue actually moves through the preferential channel? If they cannot answer with a number, the benefit is still potential.
Woven and knitted fabric: two worlds inside one company
One more technical distinction deserves explanation, because it appears in every company disclosure and most investors skim past it.
Woven fabric is made by interlacing two sets of yarn at right angles on a loom. It has little stretch, holds its shape, and is used for shirts, trousers and workwear. Knitted fabric is made by interlooping yarn, has high stretch, and is used for t-shirts, sportswear and underwear.
The two use different machinery, different dyeing processes, and serve different end products. Thanh Cong has capability in both: woven at roughly nine point six million metres a year, knitted at roughly fifteen thousand tonnes a year, with corresponding dyeing and finishing capacity for each.
Why does this matter? Because the two have demand cycles that are not fully synchronised. Sportswear and casual clothing, which use a great deal of knitted fabric, carry steadier demand and depend less on fashion seasonality. Office wear made from woven fabric is more sensitive to the economic cycle and to shifts in how people work.
A company present in both has a wider customer set and less dependence on a single consumption trend. When reading the accounts, check whether the company breaks revenue down by these two fabric families; if it does, that is a useful lens on portfolio quality.
A related question investors ask is whether the company could simply sell fabric to other garment makers rather than sewing it itself. In principle yes, and integrated producers in this industry do sell surplus fabric externally, particularly when their own sewing lines are not fully loaded. But there are two reasons this is a buffer rather than a strategy.
The first is margin: selling fabric captures the fabric layer only and forgoes the sewing layer plus the full-package mark-up. The second is customer relationships. A garment maker buying fabric from a competitor that also sews is buying from a rival, and many prefer not to. So external fabric sales tend to function as a way of absorbing spare capacity rather than as a growth channel, and a rising share of external fabric sales in the revenue mix usually signals that sewing orders are soft rather than that a new market is opening.
Watch that ratio for exactly that reason. It is one of the more useful leading indicators available in the disclosures of an integrated textile producer, and it is one that a reader who does not understand the model will misinterpret as diversification.
The price of vertical integration
Vertical integration is not free, and three costs deserve stating plainly.
The first is capital. Weaving and dyeing require expensive machinery and large-scale wastewater treatment. Depreciation is therefore far higher than at a pure sewing operation, and in years when orders are scarce that fixed cost still has to be carried.
The second is environmental. Dyeing generates wastewater with a high pollutant load, requiring investment and continuous operation of treatment systems. Many Vietnamese provinces restrict licensing of new dyeing projects. That is simultaneously a barrier against new entrants copying the model and a constraint on the incumbent’s own expansion.
The third is flexibility. An integrated producer must keep all four stages loaded. If sewing orders fall while the spinning and fabric plants keep running, the company must sell yarn and fabric into the open market at lower prices, or cut output and absorb fixed costs. A pure sewing operation simply takes fewer orders and cuts overtime.
The honest conclusion: vertical integration produces a better margin in normal conditions but makes profit far more sensitive to order volume. This is operating leverage, and leverage amplifies in both directions.
A further point on the economics of the upstream stages, which behave differently from sewing and are worth understanding separately.
Spinning converts cotton and man-made fibre into yarn, and its profitability is governed by the spread between the fibre price and the yarn price. Cotton is a globally traded agricultural commodity whose price responds to harvests, weather and the price of competing synthetic fibre. A spinner must buy fibre ahead of production, so it carries the same inventory lag effect that afflicts any commodity processor: when input prices rise, previously purchased stock is worth more and reported margin expands; when input prices fall, margin compresses and inventory may need writing down.
For an integrated producer, however, that exposure is partially internalised. If the yarn is consumed by the company’s own weaving operation rather than sold on the open market, a squeeze in the spinning spread is offset by cheaper input for the downstream stages. The consolidated result is therefore less volatile than a standalone spinner’s would be. This is one of the less obvious benefits of integration and it rarely appears in commentary.
The corollary is that you should not read the segment result of any single stage in isolation. What matters is the margin of the finished garment relative to the cost of the fibre that entered the chain, measured across the time it takes material to travel from bale to shipment. That period is typically several months, which is another reason quarterly comparisons mislead in this industry.
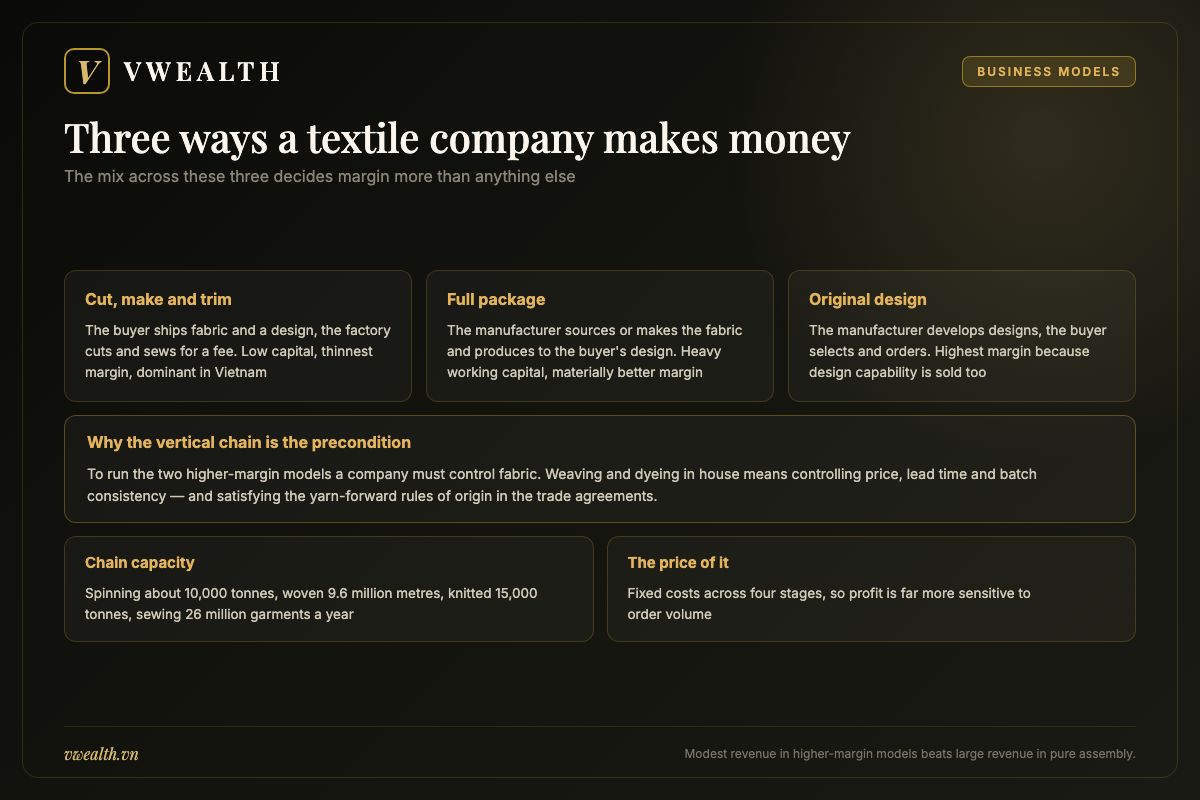
| Model | What the manufacturer does | Working capital | Margin | Requirement |
|---|---|---|---|---|
| Cut, make and trim (CMT) | Cuts and sews using the buyer’s fabric and design | Lowest | Thinnest | Only a factory and labour |
| Full package (FOB) | Sources or makes fabric, manufactures to the buyer’s design | High | Materially better | Must control fabric supply |
| Original design (ODM) | Develops its own designs, the buyer selects and orders | Highest | Highest | Design and product development capability |
Market position and financial health: reading a thin-margin exporter
This chapter does not hand you last period’s numbers. It hands you a reading method. If you are unfamiliar with Vietnamese reporting conventions, start with Vietnamese financial statements under VAS and IFRS.
Position: not the largest, but in the rare group
Thanh Cong is not the largest Vietnamese textile company by revenue. Several groups are far larger by headcount and by number of factories.
But size is the wrong yardstick for this industry. The right one is position in the value chain, and on that measure Thanh Cong sits in the very small group of Vietnamese companies self-sufficient from fibre to finished product.
What does that mean for you? It means the company does not compete head-on with thousands of sewing houses on conversion price, but in a segment with far fewer competitors. It also means it competes with integrated producers in other regional countries that are building their own weaving and dyeing capacity.
Placing TCM against the other models in the industry
To evaluate properly, picture the three company models coexisting in Vietnam today.
The first is the large pure assembly house. Revenue can be very large and headcount in the tens of thousands, but margins are thin and bargaining power is minimal. When a buyer moves orders to another country, the company has nothing to hold them with except price.
The second is the single-stage upstream specialist, spinning only or weaving only. This group sells an intermediate product, is exposed to commodity price swings, and sees profit fluctuate with the spread between cotton and yarn prices.
The third is the integrated producer, where Thanh Cong sits. Better margin, more bargaining power thanks to origin compliance and delivery speed, but carrying fixed costs across several stages and needing enough order volume to load the whole chain.
When comparing two textile stocks, the first step is to identify which model each belongs to. Applying the same earnings multiple to an integrated producer and to an assembly house is a category error, because the quality and durability of the earnings differ in kind.
It is worth adding a note on how the seasonality interacts with the reporting calendar in a way that catches out newcomers every year. Because production days differ between quarters, and because order intake for the two Western fashion seasons peaks at particular points in the year, both revenue and margin follow a recurring intra-year shape that has nothing to do with the underlying trend. An investor who buys after a strong reported quarter and sells after a weak one is, in effect, trading the calendar rather than the business.
The remedy is simple to state and easy to neglect: keep a table of the same period a year earlier alongside every figure you record, and treat any month-on-month or quarter-on-quarter observation as uninformative until you have checked it against the equivalent period in prior years. Two or three years of that table will teach you the company’s normal seasonal shape, and after that the anomalies become obvious without any analytical effort at all.
Metric one: order mix by model and by destination market
This is the most important metric, and it is not in the balance sheet; it is in management commentary and in the revenue notes.
You need two cuts. The first is revenue share by CMT, FOB and ODM. A rising FOB and ODM share signals improving revenue quality even if total revenue is flat.
The second is share by export destination. Thanh Cong exports to more than forty countries, with principal markets including the United States, Japan, South Korea, China, Europe and Canada. According to information management has previously disclosed, the United States accounted for around thirty per cent of export revenue at a recent point in time.
Track that figure continuously, because it directly measures the company’s exposure to the trade policy of a single country. A company with thirty per cent of revenue in one market will feel a major tariff change there, but it is not fatal. A company with sixty per cent in the same market is in an entirely different position.
There is one more reason destination mix deserves continuous attention rather than an annual glance. Buyers do not usually move an entire programme at once; they shift it product by product and season by season, which means a change in exposure shows up gradually in the mix long before it shows up in revenue. A destination whose share has been falling for three or four consecutive periods is telling you something about the commercial relationship, and it is telling you before management is likely to comment on it.
The same logic applies in reverse. A destination whose share is rising steadily indicates a relationship being built, and relationships in this industry are slow to form and slow to break. That inertia is why a diversified destination mix, once achieved, is genuinely defensive rather than cosmetic: it reflects multiple independent commercial relationships, each of which took years to establish and each of which would take years to lose.
When you build your own tracking file for this company, make destination mix the first table in it, with one column per period. Everything else in this chapter is easier to interpret once you can see how that table has moved.
Metric two: gross margin and its cost components
For an integrated textile producer, gross margin responds to four factors.
The first is cotton and yarn prices. Cotton is a globally traded commodity whose price moves with harvests, weather and demand. A spinner must buy cotton ahead, so there is a lag between purchase cost and selling price, similar to the dynamic in steel processing.
The second is order mix by model, discussed above.
The third is labour cost. This is a labour-intensive industry, and regional minimum wages together with social insurance contributions rise on a policy schedule. This is one-directional cost pressure; it does not reverse.
The fourth is capacity utilisation at each stage. For an integrated chain this carries the strongest leverage, because fixed costs are spread across four plants.
Metric three: the net foreign currency position
Exporters are usually assumed to benefit when the local currency weakens, but for textiles the arithmetic is more complex.
On the favourable side, export revenue is denominated in foreign currency and converts into more dong when the exchange rate rises.
On the unfavourable side, cotton, fibre, dyestuffs and much of the machinery are imported, so input costs also rise with the exchange rate. In addition, any foreign currency borrowing generates translation losses on revaluation at period end.
The correct reading is to compute the net position: foreign currency revenue less imported input costs and foreign currency debt service. Only the net portion genuinely benefits. The mechanics are set out in Vietnam dong currency risk.
Metric four: inventory days and inventory composition
A company doing FOB and ODM must carry substantial inventory: cotton, yarn, fabric, trims and finished goods awaiting shipment. This is the nature of the model, not a warning sign.
Two situations do warrant concern. The first is inventory days rising while revenue is flat, meaning output is not moving on schedule. The second is finished goods rising faster than raw materials, meaning completed product is sitting still. For seasonal fashion goods, finished inventory that misses its season loses value very quickly.
Metric five: receivables and customer concentration
For an exporter, receivables are a genuine credit risk, because collecting from an overseas customer is difficult.
Check receivable days across periods, and more importantly check customer concentration: what share of revenue comes from the largest customer, and from the top five. For TCM this question links directly to the fact that the strategic shareholder is also a customer, so read it alongside the related party note.
Metric six: borrowings and maturity structure
Textile companies use substantial short-term borrowing to fund working capital, particularly under FOB. That is the right instrument for the purpose.
Two things to check: whether short-term borrowing is proportionate to inventory and receivables; and whether short-term debt is being used to fund new plant. For a company with foreign currency borrowing, add a third step and look at the share of foreign currency debt in total borrowings.
Metric seven: disclosure quality and frequency
Thanh Cong belongs to a small group of Vietnamese listed companies that publish monthly results, an uncommon practice on this exchange. For investors that is a real advantage: you receive signals far earlier than the quarterly reporting cycle allows.
But monthly disclosure comes with a trap: it amplifies noise. Textiles are strongly seasonal, and one weak month does not indicate a deteriorating trend. Read monthly data against the same month a year earlier, or on a cumulative multi-month basis, rather than against the immediately preceding month.
Two seasonal features are worth naming explicitly. Order flow follows the two main fashion seasons of Western markets, so production volume is not spread evenly across the year. And the extended Lunar New Year holiday reduces the number of production days in one quarter each year, while factories typically continue paying to retain workers. Both distort any month-on-month comparison.
There is a working capital consequence too. In the build-up to a peak season, the company buys materials and produces ahead of collection, so inventory and short-term borrowings rise seasonally. Seeing both increase at that point in the year is normal; what is not normal is seeing them increase without a corresponding order book.
One more analytical framework helps when comparing textile companies: decompose return on equity into its three components, namely net margin, asset turnover and financial leverage.
A pure assembly house typically shows a very thin net margin combined with high asset turnover, because it owns little beyond sewing lines and buildings and does not tie up capital in materials. An integrated producer shows a better net margin but materially lower asset turnover, because spinning, weaving and dyeing plants are capital-heavy and inventory is large. The two can arrive at similar returns on equity by completely different routes.
The distinction matters because the two routes behave differently under stress. When orders fall, the assembly house’s high-turnover model degrades gracefully: it simply runs fewer lines. The integrated producer’s model degrades sharply, because its asset base and inventory do not shrink with the order book. Conversely, when orders are plentiful, the integrated producer’s operating leverage rewards it far more.
So when you see two textile companies with comparable returns on equity, do not assume they are comparable investments. Ask which components produced that return, and then ask what happens to each component in a downturn. That single question separates a considered comparison from a screening exercise.
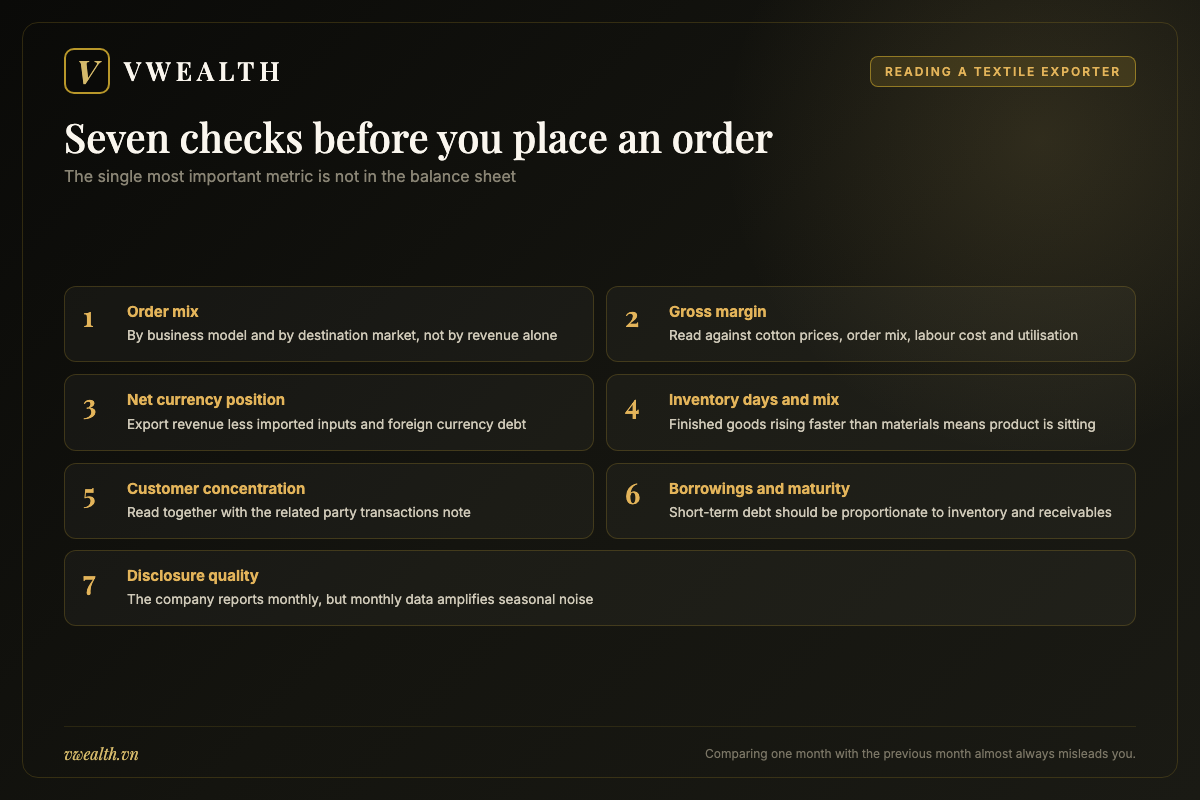
| # | Metric | Where to find it | Red flag |
|---|---|---|---|
| 1 | Order mix by model and destination | Revenue notes and management commentary | The pure assembly share rising again |
| 2 | Gross margin and cost components | Income statement, cross-checked against cotton prices | Margin compressing while cotton falls and orders hold |
| 3 | Net foreign currency position | Revenue notes, finance costs, borrowings note | Translation losses growing across periods |
| 4 | Inventory days and composition | Balance sheet and inventory note | Finished goods rising faster than raw materials |
| 5 | Receivable days and customer concentration | Receivables and related party notes | One customer at an outsized share of revenue |
| 6 | Borrowings, maturity and currency mix | Balance sheet and borrowings note | Short-term debt funding new plant |
| 7 | Disclosure quality and frequency | The full year of filings | Monthly reporting stops without explanation |
How the market treats TCM stock
A stock’s personality comes from its register, its industry and the market’s memory. TCM’s is fairly legible, and understanding it prevents the wrong expectations.
Character: a mid cap that reacts to trade news
TCM sits in the mid-cap tier on HOSE, with liquidity adequate for an individual investor but not deep enough for a large fund to build a position quickly.
What separates TCM from similarly sized names is its sensitivity to international trade policy news. Whenever there is news about tariffs in a major export market, the whole textile group reacts almost immediately and reacts together, regardless of how differently exposed each company actually is.
That is both a risk and an opportunity. The risk is that you suffer a drawdown unrelated to the company you own. The opportunity is that indiscriminate group selling creates a gap between the genuinely exposed and the barely exposed, and whoever knows each company’s destination mix sees that gap first.
A second point on character: because the company reports monthly, the share price has a denser reaction rhythm than names reporting only quarterly. A long-term holder must be prepared for months when weak data pressures the price, and must be able to distinguish a seasonally weak month from a genuine downtrend.
One practical note on how to follow this name. Because of monthly reporting and the industry’s rapid response to trade news, holders of TCM easily slip into watching too closely and trading too much. A better approach is a fixed review calendar: once a quarter, re-score the seven checks from chapter four, and between those reviews react only to the two categories of news that genuinely change the picture, namely tariff policy changes in a major market and a marked shift in the share of next-quarter revenue already covered by orders.
That discipline sounds simple and is hard to practise, because every monthly release creates a feeling that action is required. Remember that a manufacturer does not change its nature in thirty days; only the market’s mood moves that fast.
Valuation: reading an order-cycle business
Textiles are not a commodity cycle in the way steel or chemicals are, but they are an order cycle, and that shapes valuation.
The textile order cycle follows consumption in developed economies and, more immediately, the inventory cycle of retailers. When fashion chains are carrying too much stock, they cut new orders, and Vietnamese factories run short of work even though end demand has barely changed. When the inventory clears, orders snap back quickly.
The valuation consequence: do not anchor on the earnings of a bumper order year, and equally do not anchor on the earnings of a year when buyers were cutting. Use average earnings across a full cycle, typically three to five years.
Alongside that, for a company with heavy fixed assets such as spinning and dyeing plants, price to book is a useful supplementary tool, particularly in a weak order phase when earnings compress and earnings multiples lose meaning. Broader context on how this market is valued is in Vietnam stock market valuation.
Where a textile stock belongs in a portfolio
A practical question few analyses answer: what role should textiles play in a portfolio.
The defining characteristic of this group is that it is tied to consumption cycles in developed economies rather than to Vietnam’s domestic economy. That matters for asset allocation: when Vietnam’s economy is weak but consumption in export markets holds up, textile names can move against the rest of the market.
Put differently, a textile stock diversifies by source of demand, not merely by sector label. A portfolio of Vietnamese banks, property and domestic retail is almost entirely a bet on the domestic economy; adding an exporter genuinely changes the risk structure.
The offsetting point is that this group carries a risk domestic names do not: foreign policy risk. You cannot monitor it by reading domestic news, and it can appear abruptly. Related country-level risks are collected in the risks of investing in Vietnam.
The conclusion on sizing: textiles suit a small, deliberate allocation, large enough to benefit when the order cycle turns and small enough that a tariff shock does not ruin your year. If you would rather take Vietnamese exposure without single-stock risk, the trade-offs are compared in Vietnam portfolio construction, ETFs versus direct stocks.
A final observation on the relationship between this ticker and the broader Vietnamese market. Textile exporters have a low correlation with the domestic financial and property complex that dominates the local index, which is the diversification argument made earlier. But that low correlation is not stable across all conditions. In a global risk-off episode, foreign investors sell Vietnamese equities broadly, and thin-float mid caps fall alongside everything else regardless of their fundamental exposure. Diversification by demand source protects you against a domestic economic downturn; it does not protect you against a global liquidity event.
Understanding which kind of stress you are in changes the right response. If domestic property and banking are under pressure while consumption in export markets holds, a textile exporter falling with the index is a mispricing worth using. If global capital is leaving emerging markets wholesale, the same fall is not a mispricing but a repricing of the whole asset class, and adding early simply means catching more of the decline.
Distinguishing the two in real time is genuinely difficult, which is the honest reason to size positions in this part of the market conservatively rather than to rely on being right about the distinction.
Access for investors based outside Vietnam
Buying TCM requires a local securities account and a trading code, and the account opening process for a non-resident involves documentation and a custodian relationship. Complete that before you have a view you want to act on; the mechanics are in the guide to opening a brokerage account in Vietnam as a foreigner. Note also the foreign room constraint discussed in chapter two: with a strategic holder near forty-five per cent, the available room can be tight, and a foreign buy order may simply not fill.
The catalysts the market reacts to
With TCM, four categories of event move the price. The first is tariff policy news in major export markets. The second is the company’s own monthly figures. The third is disclosure about orders already secured for coming quarters. The fourth is cotton prices and the exchange rate.
Of those four, the third has the highest predictive value and receives the least attention. When management discloses what percentage of next quarter’s revenue plan is already covered by orders, that is a far weightier fact than last month’s profit figure, because it describes the future rather than the past.
Trading mechanics worth knowing before you size a position
Two mechanical features of this market shape how a position in a mid-cap exporter actually behaves, and both are easy to overlook until they matter.
The first is the daily price band. HOSE limits movement to seven per cent either side of the reference price. When a trade policy headline hits, the entire textile group can trade at the limit for consecutive sessions, which means the quoted price is not a price at which you can transact. Any exit plan that assumes you can sell into a sharp move is unreliable; assume instead that exiting during a shock takes several days.
The second is settlement timing. Vietnam settles on a T plus two basis, so shares bought are not available to sell immediately. For a long-term holder this is irrelevant; for anyone intending to react quickly to news it is a real constraint, and it is another argument for treating this as a position to be sized and held rather than traded around.
Taken together with the narrow foreign ownership room discussed in chapter two, these mechanics argue for a smaller position than the company’s fundamentals alone would suggest. Position sizing in a market like this is not only about how much you believe in the business; it is about how much you can realistically get out of when you change your mind.
Industry context: rules of origin, tariffs and regional competition
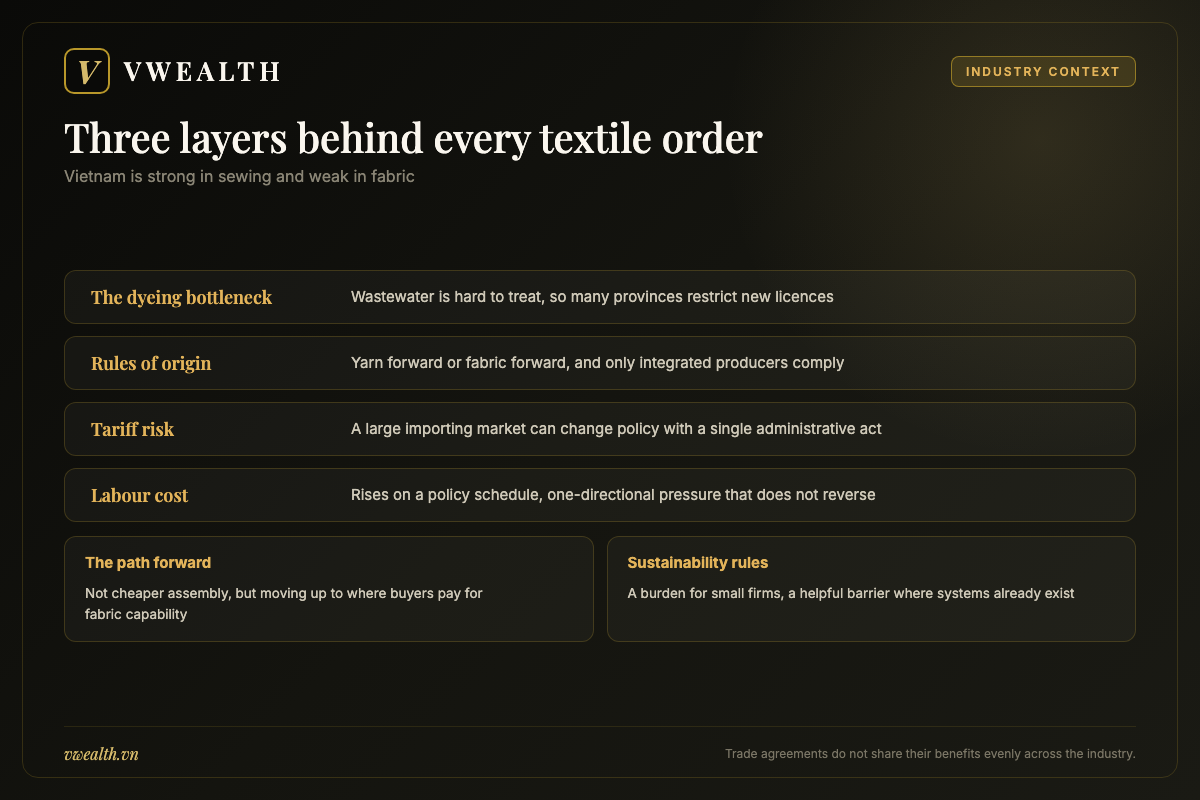
Vietnam’s textile industry operates within three layers of context, and all three are in motion.
Layer one: Vietnam’s place in the global textile supply chain
Vietnam is one of the world’s largest garment exporters, and the industry employs an enormous workforce. That position rests on three foundations: competitive labour costs, sewing skills accumulated across generations, and a broad network of trade agreements.
But there is a structural weakness spanning decades that you must grasp: Vietnam is strong in sewing and weak in fabric. A large share of the fabric used for export garments is still imported, mostly from regional suppliers.
That weakness produces two consequences. The first is that much of the industry’s value added accrues to foreign fabric suppliers rather than staying in Vietnam. The second, more relevant here, is that Vietnamese companies self-sufficient in fabric are a rare group, and that scarcity is the foundation of Thanh Cong’s position.
Why has Vietnam not simply built dyeing capacity? The principal reason is environmental. Dyeing generates wastewater that is difficult to treat, and many provinces are cautious about licensing new projects. That is an administrative barrier, and it protects companies that already operate licensed dyeing plants.
Layer two: trade agreements and rules of origin
As analysed in chapter three, the new-generation free trade agreements impose yarn-forward or fabric-forward origin conditions, and those conditions favour only companies that control their own materials.
This is the structural core of the investment case for an integrated producer: a policy-created advantage that does not depend on the cycle and cannot be replicated quickly by a competitor without a dyeing licence.
Layer three: trade policy risk in importing markets
This is the largest and least forecastable risk facing the entire Vietnamese textile industry today.
As goods made in Vietnam take a rising share of developed-market imports, the likelihood of trade measures aimed at Vietnamese-origin goods increases. Such measures can take several forms: additional country-level tariffs, product-specific trade defence cases, or stricter requirements on material traceability.
You can see the mechanism at work in another Vietnamese export sector that went first. The analysis of NKG stock describes how walls were built around a Vietnamese export industry in several developed markets, and how the companies involved were forced to redirect toward the domestic market. Textiles differ from steel in one crucial respect: domestic demand is nowhere near large enough to absorb capacity built for export, so the same redirection is not available at comparable scale.
The practical defence available to a textile company is destination diversification. That is why destination mix is the number one metric in chapter four, and why the fact that Thanh Cong sells into more than forty countries with principal markets spread across North America, East Asia and Europe is substantive rather than a line in an annual report.
The wider backdrop is worth naming. Vietnam has been a major beneficiary of manufacturing relocation out of China, a theme covered in China plus one and Vietnamese stocks. The trade defence response now emerging in developed markets is in part a response to that shift, and it falls hardest on sectors where Vietnamese output is close to a commodity and the substrate is imported.
Layer four: regional competition and labour cost pressure
Vietnam is not the only option for global fashion retailers. Countries across South and Southeast Asia compete directly in the assembly segment, often with lower labour costs. A comparison of Vietnam against its peers is drawn out in Vietnam versus other emerging markets.
Vietnam’s remaining advantage in that segment is thinning, because regional minimum wages and social insurance contributions rise on a policy schedule. This is one-directional pressure: labour costs do not fall back when the economy slows.
The strategic implication is clear, and it applies to the whole industry rather than to one company: the path forward for Vietnamese textiles is not to undercut on assembly price but to move up into segments where buyers pay for fabric capability, for delivery speed and for origin compliance. A company already positioned there is heading the right way; a company still doing pure assembly is running on a treadmill moving the other direction.
One further force is growing: sustainability requirements. Major fashion brands increasingly impose conditions on labour standards, renewable energy use, wastewater treatment and material traceability. For small companies these are a heavy compliance burden. For a company with large-scale treatment infrastructure and a vertical chain that permits material traceability, they become a helpful barrier.
Automation and the long-run question hanging over the industry
A final layer of context belongs in any honest assessment of textile investing, and it operates on a longer horizon than tariffs or order cycles.
The entire Vietnamese garment industry rests on an arbitrage: labour in Vietnam is cheaper than labour in the countries where the clothes are sold. Every serious long-term risk to the industry comes from something that erodes that arbitrage, and there are three candidates.
The first is domestic wage growth, already discussed, which narrows the gap against regional competitors rather than against developed markets.
The second is automation of sewing itself. Cutting, spreading and material handling have been substantially automated for years, but the sewing of soft, deformable fabric has resisted automation far longer than most manufacturing processes, because the material moves unpredictably under the needle. Progress here has been real but slow. If it accelerates meaningfully, the value of low-cost sewing labour falls and production can move closer to the point of consumption.
The third is a shift in how apparel is bought: shorter lead times, smaller batches and more frequent replenishment favour production located near the market, even at higher unit cost, because the saving comes from selling fewer items at markdown rather than from the cost of the garment.
How does this affect the case for an integrated producer specifically? Favourably, on balance. All three forces push the industry away from competing on labour cost and toward competing on capability, speed and material control, which is exactly where a vertical chain has its advantage. A company that sells only labour is exposed to all three; a company that sells fabric capability, origin compliance and short lead times is partially insulated.
That said, none of this is a reason to expect rapid change. These are decade-scale forces, and their main practical use for an investor today is directional: when choosing between textile names, prefer the ones whose competitive position does not rest solely on the wage gap.
| Force | Effect on a pure assembly house | Effect on an integrated producer |
|---|---|---|
| Rules of origin in trade agreements | Fails the test when fabric comes from outside the bloc | Passes, creating a supplier selection advantage |
| Country-level tariffs | Fully exposed, with no way to mitigate | Exposed, and the origin advantage is partly neutralised |
| Scheduled increases in labour cost | Erodes an already thin margin directly | Milder, because several value layers absorb it |
| Regional assembly competition | Head-on price competition | Less affected, competing in a different segment |
| Brand sustainability requirements | Compliance cost heavy relative to size | A helpful barrier where systems are already in place |
| Cotton prices and the exchange rate | Little effect, since materials are not purchased | Direct effect, with a lag that must be tracked |
Outlook: orders, tariffs and three scenarios for Thanh Cong
This chapter contains no price target. It describes the forces at work, then builds three scenarios with the conditions each requires and the early signals that identify which one you are in.
Five forces pushing forward
The first is the shift of order mix toward higher value models. Every percentage point moving from pure assembly into full package or original design improves margin without any increase in volume, and it does so permanently rather than cyclically.
The second is the rules of origin advantage in the free trade agreements. This is structural rather than cyclical, and it is available only to the small group of companies with an integrated chain.
The third is the relationship with a strategic shareholder in fashion retail. That relationship provides a relatively stable base of orders, something an independent contract manufacturer does not have.
The fourth is the tightening sustainability requirements of major brands. The paradox is that the stricter those requirements become, the more they favour a company that has already invested in treatment infrastructure and can trace its materials.
The fifth is the inventory cycle of global retailers. After each destocking phase, orders tend to rebound quickly, and a manufacturer with fabric on hand and short lead times captures a disproportionate share of the urgent orders that follow.
Four forces pushing back
The first is tariff policy risk in major importing markets, particularly the market with the largest share of revenue.
The second is labour cost rising on a policy schedule, one-directional pressure in a labour-intensive industry.
The third is the operating leverage of the vertical chain. When orders fall, profit falls faster than revenue because fixed costs at all four stages still have to be carried.
The fourth is regional competition, both in low-cost assembly and, increasingly, in the integrated segment as other countries build their own weaving and dyeing capacity.
Base case: a slow climb through order mix
In this scenario orders hold at a level sufficient to keep the plants at acceptable utilisation. The order mix shifts gradually toward the higher-margin models, improving gross margin incrementally year by year. Labour costs rise but are offset by the mix improvement. Tariff policy in the major markets does not change dramatically. The company maintains its dividend.
Conditions required: consumer demand in the principal export markets does not fall sharply; no major tariff change occurs; cotton prices move within a normal band.
Early signals: the share of higher-value orders rises across periods; the proportion of next-quarter revenue already covered by orders stays high; gross margin moves sideways or edges up.
On current information this is the highest-probability scenario. In it, the shares behave like a stable manufacturer paying a dividend rather than like a growth story, and the return comes from the dividend plus slow compounding rather than from a re-rating.
Bull case: a favourable order cycle and a re-rating on position
In this scenario three things happen close together. First, the inventory cycle at global retailers turns, orders become plentiful and the plants run at full capacity. Second, the original design share rises materially, lifting margin onto a new plateau. Third, the market begins to value TCM on its integrated position rather than lumping it in with the assembly houses.
Conditions required: consumer demand in developed markets recovers; the company sustains its design and product development capability; and no major tariff shock intervenes.
Early signals: utilisation rises simultaneously across all four stages; gross margin improves and holds across several consecutive quarters rather than spiking once and falling back; the company visibly widens its customer base beyond the related party group.
Given the operating leverage of the vertical chain, a favourable order phase can lift profit far more than revenue. That asymmetry is precisely what makes textile names attractive in a recovery phase, and precisely why they are dangerous to hold through a downturn without position discipline.
Bear case: a tariff shock combined with a weak order cycle
In this scenario a significant change in tariff policy in an important export market causes buyers to shift orders elsewhere or to demand that the manufacturer share the tariff cost. At the same time consumer demand in developed markets weakens and retailers cut orders. Plants run below capacity while the fixed costs of four stages still have to be carried. Finished inventory from last season loses value. Labour costs continue to rise on schedule.
Conditions required: an adverse tariff change in a large market; a prolonged decline in consumer demand.
Early signals: the share of next-quarter revenue covered by orders falls markedly; finished goods inventory days rise; gross margin compresses across several consecutive periods; the dividend plan is revised down.
Be clear about the scope. This describes a period of poor financial performance, not a threat to the company’s survival. Thanh Cong has a history approaching sixty years, has passed through several industry disruptions, and owns real productive assets. What you must prepare for is waiting time.
| Scenario | Conditions required | Early signals | Consequence for the investor |
|---|---|---|---|
| Bull | Order cycle turns, original design share rises | All four stages run full, margin improvement sustained across quarters | Operating leverage lifts profit faster than revenue |
| Base | Orders fill capacity, mix shifts gradually | Higher-value share rising, next-quarter order coverage holding | Behaves like a stable dividend-paying manufacturer |
| Bear | Tariff shock plus weak consumer demand | Order coverage falling, finished inventory rising, margin compressing | Profit falls faster than revenue through operating leverage |
A note on how to weigh the strategic shareholder in these scenarios, because it cuts differently in each.
In the base case, the relationship is stabilising: it keeps a floor under utilisation when independent buyers are cautious, which is precisely when a factory most needs volume. In the bull case, it is neutral or mildly limiting, because capacity dedicated to the shareholder’s ecosystem cannot be sold to whoever is paying most in a tight market. In the bear case, it matters most of all, and its value depends entirely on the health of the shareholder’s own retail business. A fashion retailer under pressure cuts orders like any other buyer.
The practical implication is that a serious analysis of TCM includes at least a cursory read of the strategic shareholder’s own trading conditions. That is unusual advice for a Vietnamese mid cap, but it follows directly from the ownership structure: when a single related group accounts for a meaningful share of the order book, its health is part of your risk, whether or not it appears anywhere in the Vietnamese filings.
One further scenario consideration concerns capital allocation. If the base case persists for several years, the company faces a choice between returning cash through dividends and investing in additional capacity, most plausibly in sewing capacity in lower-cost provinces or in expanded fabric capability. Watch which way that choice goes and on what stated return assumptions. A company that keeps paying while capacity sits underutilised is being disciplined; a company that expands capacity into a soft order environment is taking a risk that its shareholders should understand before it is taken.
What would break the thesis
Every investment case should be written down together with the evidence that would falsify it. For TCM, four developments would genuinely change the picture rather than merely making a quarter look bad.
The first is the pure assembly share of orders rising again across several periods. If the company has to retreat into the low-margin model to keep capacity loaded, the advantage of the vertical chain is not being converted into cash, and the core argument of this analysis weakens.
The second is a policy change that strips the commercial value from rules of origin, for instance a large market applying a country-level tariff high enough to erase the gap between compliant and non-compliant goods. In that case a moat created by policy is removed by policy.
The third is gross margin failing to recover even as cotton prices fall and orders improve. That would indicate a problem of bargaining position rather than of input cost, and bargaining position is hard to regain.
The fourth is governance deterioration: a sharp unexplained rise in related party revenue, a decline in disclosure quality, or the company ceasing to publish monthly figures. At a company whose largest shareholder is also its commercial counterparty, transparency is not a formality.
Write those four down before you buy and review them at every results release. A thesis you cannot falsify is not a thesis; it is a hope.
So, should you buy TCM stock?
You now have the material to answer for yourself. This section weighs the arguments and then says which kind of investor this ticker suits.
The case for
First, a vertically integrated chain running from fibre to finished garment is a rare asset in Vietnamese textiles. It cannot be copied quickly, because the barrier is not only capital but the environmental licensing required for dyeing.
Second, that chain is the precondition for meeting rules of origin under the new-generation free trade agreements, which is a policy-created and structural advantage rather than a cyclical one.
Third, the chain is also the precondition for operating the full-package and original design models, both of which carry materially better margins than pure assembly.
Fourth, the largest shareholder is a foreign fashion retail group, which supplies a relatively stable order base and imposes international operating standards.
Fifth, exports reach more than forty countries with principal markets spread across North America, East Asia and Europe, which limits concentration risk in any single jurisdiction.
Sixth, the company maintains a dividend, distinguishing it from many smaller textile names that retain everything.
Seventh, monthly reporting gives investors signals far earlier than the standard quarterly cycle, which is a genuine informational advantage for anyone willing to read it properly.
Eighth, the environmental licensing barrier that constrains new dyeing capacity protects the incumbent’s position, and that protection strengthens rather than erodes as environmental standards tighten.
The case against
First, this remains a labour-intensive industry with thin margins by general standards, and labour costs rise on a one-directional policy schedule.
Second, the vertical chain creates operating leverage: when orders fall, profit falls faster than revenue because the fixed costs of four stages remain.
Third, trade policy risk in major importing markets is real, hard to forecast, and unlike some other sectors, textiles cannot redirect to the domestic market at comparable scale.
Fourth, the largest shareholder is also a commercial counterparty, so minority investors must read the related party note rather than skipping it.
Fifth, foreign ownership room is narrow because the strategic shareholder holds close to forty-five per cent, which limits the stock’s ability to benefit from foreign inflows.
Sixth, finished fashion inventory loses value quickly once it misses its season, so inventory risk here differs in character from that of a materials producer.
Seventh, the July 2026 forced sale of a board member’s shares shows that insider ownership can move and can create unexpected supply.
Eighth, for a foreign investor there is a currency layer on top of everything else: earnings and the share price are denominated in dong, and your return in your home currency depends on the exchange rate as well as on the business.
| Argument for | The offsetting argument |
|---|---|
| A vertical chain from fibre to finished garment | Operating leverage makes profit more sensitive to order volume |
| Meets rules of origin under trade agreements | Partly neutralised if a market imposes a country-level tariff |
| Can operate the higher-margin business models | Requires heavy working capital and carries material price risk |
| Strategic shareholder is a fashion retailer | The customer is also the owner, so related party terms matter |
| Exports spread across more than forty countries | Still meaningfully dependent on the single largest market |
| Maintains a dividend and reports monthly | Monthly data amplifies seasonal noise |
| Environmental licensing protects the incumbent | The same barrier constrains the company’s own expansion |
Which investor does this suit
The patient value investor is the natural owner. If you understand why a vertical chain is a rare asset, accept that its benefit shows up gradually through order mix rather than in one explosive quarter, and are willing to hold through a full order cycle, TCM offers exactly what you are looking for.
The cycle investor also has a place here, but must play by the rules of the order cycle: buy when global retailers are cutting orders and the sector is being sold indiscriminately, sell when orders are plentiful and margins sit at the top of their range. That requires watching retailer inventory conditions in developed markets rather than Vietnamese macro data.
The income investor can consider TCM as a small part of a dividend sleeve, remembering that the payout depends on the order cycle and can be trimmed in a difficult year.
The short-term trader and the newcomer should think carefully. This ticker reacts strongly to international trade news, a category you cannot control and which arrives without warning. If you still want the exposure, cap the position size and set risk rules in advance. For a lower-volatility starting point in this market, the discussion of Vietnam blue chip stocks is a better place to begin.
Finally, a word about expectations. Nothing in this analysis describes a company that will transform quickly. The vertical chain is already built; the customer relationships already exist; the plants are already located where they are. What changes from here is incremental: a percentage point of order mix, a point of utilisation, a destination whose share drifts up or down. An investor who needs a story to break in six months will find this frustrating. An investor who is content to be paid a dividend while a well-positioned manufacturer compounds slowly, and who is prepared to add when the sector is being sold indiscriminately, is much better matched to what this business actually offers.
That, in the end, is the honest summary of this ticker: a rare industrial asset attached to an ordinary industrial cycle, held by an owner whose interests mostly but not entirely align with yours, in a country whose export industries are entering a period of greater trade friction than they have known for two decades. Whether that combination is attractive depends far less on the company than on the price you pay for it and the patience you bring to holding it.
Closing thoughts
Thanh Cong Textile is the story of a company that began in weaving in 1967, and that starting choice is what later allowed it to build a vertical chain thousands of garment companies cannot have. In an industry where most Vietnamese firms sell only labour, this is one of the few that sells fabric capability as well.
But the same chain is also the difficulty. All four plants must have work for the model to be efficient. When orders are plentiful, operating leverage pushes profit up quickly; when buyers cut, the same leverage pulls it down just as fast. And above all sits a variable entirely outside the company’s control: the trade policy of importing countries, which can change through an administrative decision made thousands of kilometres from the factory.
So, should you buy TCM stock? If you understand that you are buying an export manufacturer with a rare position in the value chain, know how to track order mix by model and by destination, accept that profit will swing with the order cycle of global retailers, and have the patience to hold through a cycle, then TCM is a defensible choice within Vietnamese textiles. If you are buying because a valuation multiple looks cheap in a bumper order year, or because of a trade agreement headline you have not tested against the share of revenue actually moving through the preferential channel, then you are buying an expectation rather than a business.
One last thing to carry with you. The vertical chain, the plants and the strategic shareholder relationship change slowly. Order mix, destination share, gross margin, inventory days and importing-country tariff policy change every quarter. Before you place an order, open the latest research report and re-score the seven checks from chapter four. It takes fifteen minutes, and it is the most valuable fifteen minutes in your decision process. If you do not yet have the tools to do it, create a free vwealth account and let the platform read the filings for you.
This article is provided for information and analysis purposes only and does not constitute a recommendation to buy or sell any security. All investment decisions are your own and you bear responsibility for their outcome. Consider consulting a licensed financial adviser before acting.
Research Vietnamese stocks in English with vwealth. Our AI-powered platform turns Vietnamese market data into full English analysis reports — with international payment support and a free 2-month trial for new accounts. Create your free account and read the latest reports.