Vietnam economic data is public, free and mostly available in English — but it is scattered across six or seven institutions, several of which changed name in 2025, and almost every headline number carries a convention that trips up first-time readers. This guide maps the official sources one by one, tells you what each publishes and when, and then works through the specific ways foreign analysts misread Vietnamese statistics: registered versus disbursed FDI, cumulative year-to-date figures presented as if they were monthly, credit growth measured from the previous year end, and estimates that quietly become something else two years later.
The source map: who owns which numbers
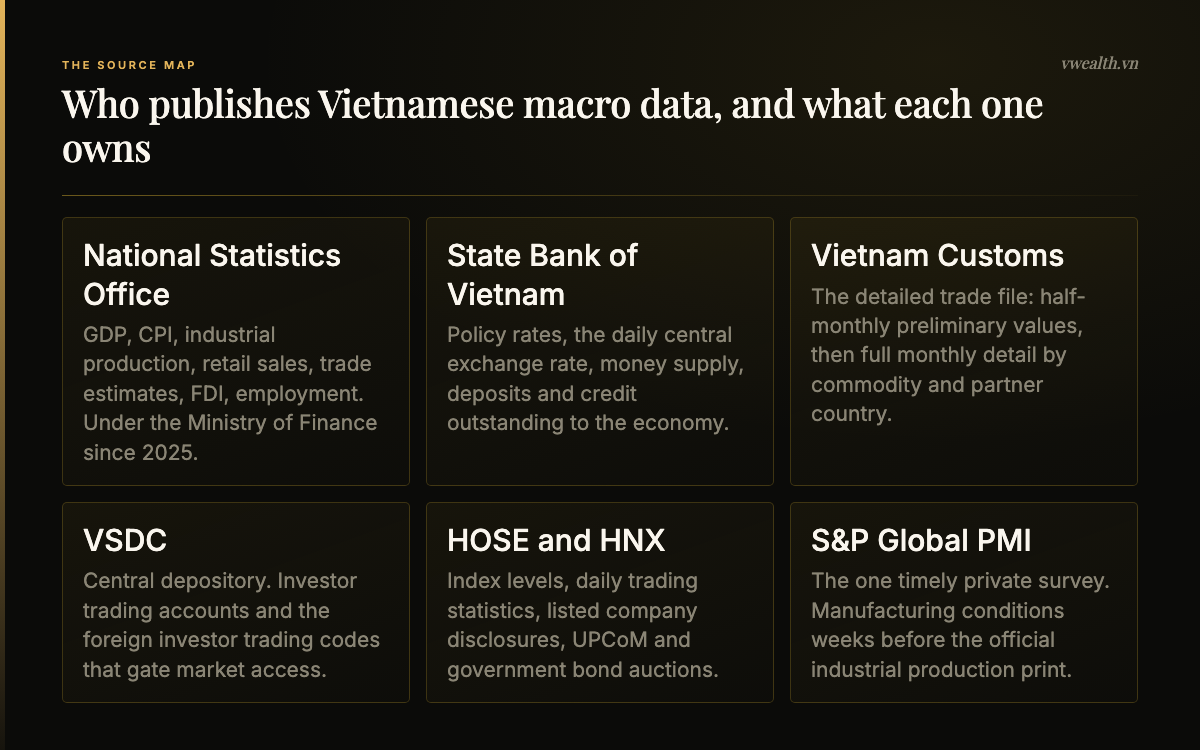
There is no single Vietnamese equivalent of the Bureau of Economic Analysis or the Office for National Statistics that publishes everything. Responsibility is split, and the split is not always intuitive. The National Statistics Office produces GDP, prices, industrial production, retail sales, employment and the first estimate of trade. The State Bank of Vietnam owns everything monetary: policy rates, the exchange rate, money supply and credit. Customs owns the detailed trade file that eventually replaces the statistics office estimate. The depository and the two exchanges own market plumbing data. One private survey, the manufacturing PMI, gets there before all of them.
The practical consequence is that a Vietnam monitoring routine is a routine across institutions, not a routine across one website. Once you know which body owns which number, the calendar becomes predictable and the work takes about twenty minutes a month.
The National Statistics Office: the primary source, under a new name
Start here. Nearly every Vietnamese macro figure you will see quoted in a broker note or a wire story originates with this office, and its English site is genuinely usable.
What changed in 2025, and why the old acronym still appears
If you have followed Vietnam for any length of time you know the agency as the General Statistics Office, or GSO. That name is now historical. The office’s own development history page records that it was created on 21 December 1960, when the National Assembly Standing Committee issued Decision No. 15/NQ-TVQH separating the Central Statistics Office from the State Planning Committee and establishing the General Statistics Office. It then records the change: on 26 February 2025 the Ministry of Finance issued Decision No. 384/QD-BTC stipulating the functions, duties, powers and organisational structure of the National Statistics Office under the Ministry of Finance (National Statistics Office, development history).
Two things follow from that. First, the correct current name in English is the National Statistics Office, abbreviated NSO, and its functions page states plainly that it “is an agency under the Ministry of Finance” (NSO, functions and duties). It no longer sits under the Ministry of Planning and Investment, which is where older documents and older bookmarks will send you. Second, you will still meet “GSO” everywhere — in older research, in database field names, in aggregator source labels, and in URL paths on the office’s own website, where the about section still sits at /en/about-gso/. Treat GSO and NSO as the same body. Do not treat a document citing GSO as necessarily out of date, but do check its year.
The English entry point is nso.gov.vn/en. English coverage is good for headline releases and thinner for the deep data tables, where you will sometimes find only Vietnamese column headings on an otherwise numeric spreadsheet.
What the NSO publishes
The workhorse product is the monthly socio-economic situation report. It is a single document that carries, in one place, GDP when the month closes a quarter, the consumer price index, the index of industrial production, retail sales of goods and services, exports and imports, foreign direct investment, tourist arrivals, and enterprise registrations. Around it sit standalone releases for CPI and industrial production, an infographic version, statistical data tables by domain, and the annual Statistical Yearbook. The monthly reports are collected at nso.gov.vn/en/monthly-report.
To see how much sits in one release: the July and seven months 2026 report gives the index of industrial production for July as an estimated 1.2% expansion month-on-month and 14.5% year-on-year, with the seven-month IIP up 11.4%; retail sales of consumer goods and services for the seven months at an estimated VND 4,555.8 trillion, up 13.1%; exports of goods at USD 319.53 billion, up 21.7%; imports at USD 340.05 billion, up 34.8%; a goods trade deficit of USD 20.52 billion; 13.9 million international arrivals, up 13.8%; and 187.2 thousand newly established and resumed enterprises, up 7.5% (NSO, socio-economic performance in July and seven months of 2026). That is the whole real economy in one file, published free, in English, on the third of the following month.
The release calendar, and why the famous “day 29” rule is now wrong
For years Vietnam had one of the strangest publication conventions in the world: the statistics office released the month’s data on the 29th of that same month, before the month had ended. Quarterly GDP appeared on the 29th of the last month of the quarter, so first-quarter growth was published on 29 March. This is still repeated in a great deal of commentary, and it is out of date.
The office’s own advance release calendar shows the change precisely (NSO release calendar). Through the July 2024 reference month, the monthly socio-economic report is scheduled on the 29th: 29 January 2023, 29 March 2023, and so on through 29 July 2024. The August 2024 report is scheduled for 6 September 2024. From then on the pattern holds at the 6th of the following month throughout 2025, and in 2026 it moves earlier again: January through March 2026 data on the 6th, then April 2026 data onward on the 3rd of the following month.
The same calendar sets quarterly GDP. For 2026: fourth quarter and full-year 2025 GDP on 6 January 2026, first quarter 2026 on 6 April, second quarter and first half on 3 July, third quarter and nine months on 3 October. In other words, Vietnam now publishes quarterly GDP within three to six days of the quarter ending. That is still fast by international standards — faster than the United States or the euro area — but it is no longer the anomaly of publishing a quarter before the quarter finished.
Why this matters for you: if your model or your calendar still expects Vietnamese data on the 29th, you will be a week late to every print, and you will misdate the historical series when you compare a data point to the market reaction around it. The move also removed a genuine oddity — figures for the last two or three days of every month used to be projections rather than observations.
Estimate, preliminary, official: the revision ladder
Vietnamese national accounts pass through three formal statuses, and the release calendar labels each one. A year’s GDP is first published as an Estimate, in the fourth-quarter report in early January. It is then reissued as Preliminary, and only later as Official. The calendar shows 2024 GDP moving to Preliminary status on 6 April 2025 and 2023 GDP moving to Official status on 6 October 2025. On the 2026 calendar, the 3 October entry carries 2025 GDP as Preliminary and 2024 GDP as Official.
Read that ladder carefully, because it means a Vietnamese GDP figure becomes final roughly twenty-one months after the year it describes ends. Everything you see quoted for the current year, and for the year just finished, is an estimate that will move. If you are building a valuation off nominal GDP, or a credit-to-GDP ratio, or anything where the denominator matters, note which vintage you used and expect it to change.
One more methodological point worth knowing: the national accounts tables are still published at constant 2010 prices (NSO, national accounts). When you see a real growth rate for Vietnam, that is the price base behind it.
If you want the investment consequences of all this rather than the plumbing, our companion piece on Vietnam GDP and the stock market works through why a strong growth print and a strong index are much less tightly linked here than newcomers assume.
State Bank of Vietnam: rates, credit and the exchange rate
The central bank is the second pillar, and the one where the English coverage thins out fastest. Its English entry page is sbv.gov.vn/en. The statistical tables themselves do not live there: they sit on a separate reporting portal that the main site links out to, whose menu paths are Vietnamese-only and which is frequently slow or unreachable from outside Vietnam. Budget time for it, and do not build an automated pull against it.
Four families of data matter for an investor.
Policy rates. The State Bank sets a refinancing rate, a rediscount rate and rates for overnight lending in the interbank electronic payment system. Each change is issued as a numbered decision and announced on the main site, and the historical series is collected on the reporting portal under the announced-rates menu, with interbank market rates under a separate menu. Note the structural point that matters more than the rates themselves: Vietnamese monetary policy is not primarily transmitted through a single policy rate the way it is in developed markets. Quantity matters more than price.
Credit. Outstanding credit to the economy is published on the reporting portal, alongside basic indicators for credit institutions including the loan-to-deposit ratio and the non-performing loan ratio against total outstanding credit. Credit is the single most important macro variable in Vietnam because the economy is bank-financed rather than market-financed; if you have not read our guide to the Vietnam banking system, the credit quota mechanism explained there is the missing context for every credit number you will read.
The exchange rate. The State Bank publishes a daily central rate for the dong against the dollar, around which commercial bank quotes may move within a permitted band. This is a managed float, not a peg and not a free float, and the distinction changes how you should think about currency risk in a Vietnamese portfolio — a subject we treat in full in Vietnam dong currency risk for foreign investors.
External accounts. The balance of payments is published on the main site under its own heading. This is the slowest of the four families and typically runs a couple of quarters behind.
Two working notes. First, expect a lag: monetary and banking statistics are published months behind the reference period, which is why market participants often rely on the credit growth figure quoted in government meetings before it appears in a table. Second, expect Vietnamese. If your workflow depends on English column headings, the central bank is where it will break, and where a translation step has to be built into your process rather than hoped for.
Ministry of Finance and Customs: the trade file
Vietnam is one of the most trade-exposed economies on earth — the World Bank puts exports of goods and services at 98.2% of GDP in 2025 — so the trade data is not a secondary indicator here, it is close to a coincident indicator of the whole economy.
Trade numbers arrive twice. The National Statistics Office publishes an estimate in the monthly socio-economic report, at the top of the following month. The customs authority, which sits under the Ministry of Finance, then publishes the detailed file: values by commodity group and by partner country, at a granularity the statistics office release does not attempt. Its site is customs.gov.vn, which takes a language parameter in the URL, though in practice the statistics pages are far more complete in Vietnamese than in English.
The distinction to hold on to is estimate versus detail. If you need to know how much Vietnam exported last month, the statistics office number is available first and is close enough. If you need to know how much Vietnam exported in a specific commodity line to a specific market, you need the customs file and you need to wait for it. Analysts who mix vintages — a customs figure for one month against a statistics office estimate for the next — produce month-on-month changes that are partly an artefact of the source switch rather than of trade.
The July and seven months 2026 report gives the shape of the current picture: total export and import turnover of goods for the seven months at USD 659.58 billion, up 28.1% year-on-year, with a goods trade deficit of USD 20.52 billion. For a country that has run persistent goods surpluses for most of the last decade, a deficit of that size is exactly the kind of thing worth checking against the customs detail before drawing a conclusion, because it may reflect a surge in imported inputs ahead of export production rather than a deterioration in competitiveness. Our piece on Vietnam manufacturing and industrial stocks covers how that import-for-export dynamic runs through the listed supply chain.
Market plumbing: VSDC, HOSE, HNX and the SSC
Macro data tells you about the economy. A separate set of sources tells you about the market itself, and for Vietnam these matter more than usual because participation data is one of the better read-outs on domestic sentiment.
VSDC. The Vietnam Securities Depository and Clearing Corporation is the central depository. It registers securities, clears and settles trades, runs the e-voting platform, and — the part investors watch — allocates trading codes to foreign investors and reports the number of investor trading accounts. Its English site is vsdc.vn/en, and the statistics panel on the home page carries running totals. Read in late August 2026, that panel showed 13,657,838 investor trading accounts, with 47,488 trading codes issued to foreign individuals and 6,554 to foreign institutions. The monthly change in accounts is the number to track, not the level; a sharp acceleration in new account openings has historically coincided with retail-driven phases of the market.
The exchanges. The Ho Chi Minh Stock Exchange, at hsx.vn, publishes index levels including the VN-Index and VN30, daily trading statistics and listed company disclosures. The Hanoi Stock Exchange, at hnx.vn, does the same for its own board, and also operates UPCoM and the government bond market. Both sites carry an English toggle; both are more complete in Vietnamese. Foreign ownership room is the data point most often needed and most often stale in third-party feeds, which is a problem we unpack in foreign room in Vietnamese stocks.
The regulator. The State Securities Commission, at ssc.gov.vn, publishes regulation, licensing and market administration material. You will not use it monthly, but it is where rule changes appear first, and rule changes have moved this market more than earnings have in some years.
The one survey that beats the official calendar: S&P Global Vietnam Manufacturing PMI
The purchasing managers’ index for Vietnamese manufacturing, compiled by S&P Global and published through its PMI service at pmi.spglobal.com, is the only widely followed high-frequency private indicator for the economy. It is a diffusion index built from a survey panel of manufacturers, with 50.0 as the no-change level: readings above 50.0 indicate improving conditions on the month, readings below 50.0 indicate deterioration, and the distance from 50.0 indicates the breadth of the change rather than its magnitude in output terms.
Its value to a Vietnam watcher is timing. The PMI for a month is published early in the following month, ahead of the statistics office bundle, which makes it the first read on manufacturing conditions and therefore the first read on the export engine. Check the exact date against S&P Global’s own release schedule rather than assuming it, since the calendar is set by the compiler and not by any Vietnamese body. Its limitation is that it is a survey of direction, not a measurement of level. A PMI at 52 tells you more firms reported improvement than deterioration; it does not tell you industrial production rose 5%. When the PMI and the official index of industrial production disagree, the usual reason is that one is measuring breadth across firms and the other is measuring volume weighted by size, and in an economy where a handful of very large foreign-invested electronics plants dominate output, breadth and volume can genuinely diverge.
The international mirrors, and what they are good for
Multilateral institutions do not generate Vietnamese primary data. They restate it, sometimes adjust it, and add forecasts and analysis. That makes them the right source for context and the wrong source for the latest print.
World Bank. The Vietnam country page is at worldbank.org/en/country/vietnam, and the recurring publication to read is the Viet Nam Economic Update, whose May 2026 edition projected 6.8% growth for 2026. Comparable indicator series sit at data360.worldbank.org and through the free open data API. Pulled from that API — series last updated 13 July 2026 — Vietnam’s real GDP growth reads 2.6% in 2021, 8.5% in 2022, 5.0% in 2023, 7.0% in 2024 and 8.0% in 2025; GDP in current dollars reaches about USD 514.7 billion in 2025, with GDP per capita around USD 5,066 and a population of 101.6 million; consumer price inflation runs 3.3% in 2025.
The same API illustrates the mirrors’ central weakness. Ask it for domestic credit to the private sector as a share of GDP — one of the most important structural facts about Vietnam — and the most recent observation available is 2022, at 125.0% of GDP. The series is three years stale. That is not an error; it reflects the lag with which harmonised international series are compiled. But it means a mirror is the right tool for a comparison across countries and the wrong tool for a judgement about this quarter.
IMF. The Fund’s Vietnam country page is at imf.org/en/Countries/VNM. The publication that repays reading is the Article IV consultation staff report, which is where you will find the most candid external assessment of the banking system, the exchange rate regime and fiscal position — in language a Vietnamese official body would not use about itself.
ADB. The Asian Development Bank maintains Viet Nam country and economy pages at adb.org. Its flagship regional forecast publication is the Asian Development Outlook, useful mainly because it forecasts Vietnam on the same methodology and in the same document as its regional peers, which makes relative calls easier than reading each country’s national forecast separately.
A note on aggregators. Commercial services such as CEIC and free ones such as Trading Economics both re-publish Vietnamese data, and both are convenient. Three cautions apply. They inherit the source’s revision ladder without always flagging vintage, so a series may silently change under you. They label sources by old institutional names, so you will see GSO long after the office became the NSO. And free tiers frequently lag the primary release by hours or days, which is fine for research and not fine if you are trading the print. Use them to build a chart quickly; check the primary source before you act on the last data point.
Five ways foreign investors misread Vietnamese data
1. Reading registered FDI as money that arrived
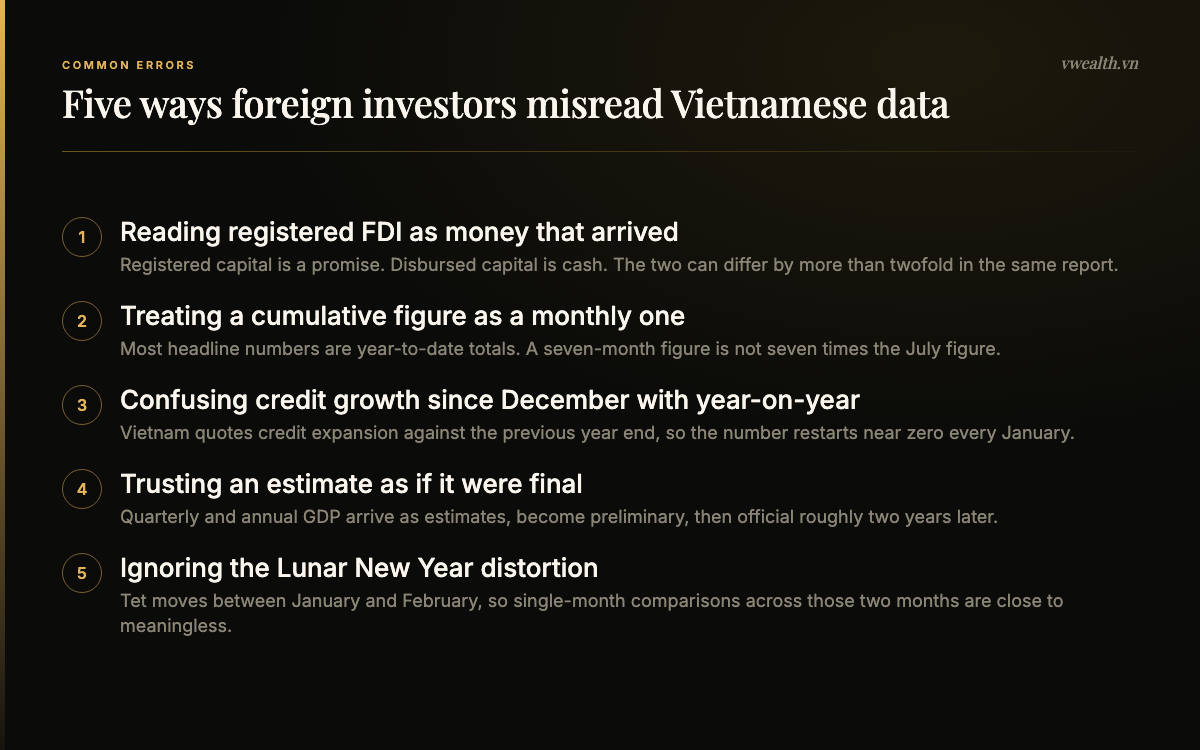
This is the most common and the most consequential error. Vietnam reports two entirely different FDI numbers in the same paragraph of the same release, and headlines routinely take the larger one.
Registered capital is the total value of investment that foreign investors have committed on paper: newly registered capital in new projects, adjusted capital added to existing projects, and the value of capital contributions and share purchases. It is a promise. Disbursed or implemented capital is money actually deployed into the ground — factories built, equipment imported, wages paid. It is cash.
The seven months of 2026 show how far apart they can run. Total inward foreign investment as of 31 July 2026, counting newly registered capital, adjusted registered capital and the value of capital contributions and share purchases, reached USD 38.06 billion, a year-on-year increase of 58.0%. Total disbursed FDI over the same seven months reached an estimated USD 15.20 billion, up 11.8% (NSO, July and seven months of 2026).
Two and a half times the size, and five times the growth rate. A story built on the 58% figure describes sentiment and intention. A story built on the 11.8% figure describes construction activity, imported capital equipment and industrial park demand, which is what actually flows through to listed companies this year. Registered capital is a leading indicator with a long and unreliable lag; disbursed capital is a coincident indicator. Cite whichever you mean, and never compare one country’s registered figure to another country’s realised figure.
2. Treating a cumulative figure as a monthly one
Vietnamese releases lead with year-to-date cumulative totals. The report is not titled “July”, it is titled “July and seven months”, and most of the numbers inside it are seven-month totals compared with the same seven months a year earlier. Exports of USD 319.53 billion is a seven-month figure. Retail sales of VND 4,555.8 trillion is a seven-month figure. FDI of USD 38.06 billion is measured as of 31 July, cumulative from 1 January.
If you drop a cumulative figure into a monthly time series you will produce a chart that rises relentlessly through the year and collapses every January. It happens more often than you would think, usually when a number is lifted from a headline rather than from a table. The defence is simple: for every Vietnamese figure, ask whether the period is the month or the year to date, and if the release title contains the phrase “and N months”, assume cumulative unless the sentence says otherwise.
The corollary is that deriving a clean monthly series requires differencing consecutive cumulative prints, and that the difference inherits the revisions in both. Small monthly numbers derived from two large cumulative numbers are noisy by construction.
3. Confusing credit growth since year end with year-on-year credit growth
Vietnam conventionally quotes credit expansion against the previous year end rather than against the same date a year earlier. When an official says credit has grown 8%, the near-certain meaning is 8% since 31 December, not 8% versus the same month last year. The two measures can differ by several percentage points at any point in the year, and the year-to-date measure resets to roughly zero every January, which makes an unadjusted year-to-date series look like a sawtooth.
This matters because the annual credit growth target is one of the most market-moving policy variables in Vietnam. The banking system operates under quotas, and the pace at which the system uses up its allowance through the year determines both bank earnings and liquidity conditions for property developers and brokers. Reading a year-to-date figure as a year-on-year figure will make you think growth is slowing in the first quarter of every year, when nothing has changed.
4. Trusting an estimate as though it were final
Covered above, but worth restating as a discipline rather than a fact. Every current-year Vietnamese GDP number is an estimate. Every prior-year number is probably preliminary. Official status arrives roughly twenty-one months after the year ends. When you build a ratio with GDP in the denominator, record the vintage. When you compare your ratio to a number published two years ago, check whether the denominator has since changed. The revision ladder is published openly on the release calendar; there is no excuse for being surprised by it.
5. Ignoring Tet
The Lunar New Year holiday moves between late January and mid-February. In the year it falls in January, January output collapses and February rebounds; in the year it falls in February, the reverse. Any single-month comparison spanning those two months, in either direction, is close to meaningless, and any year-on-year comparison of January alone is comparing a holiday month to a working month roughly half the time.
The standard defence is to read January and February together as a combined two-month figure, which is exactly why the NSO publishes a “February and first two months” report. The office is telling you how to read it. Take the hint.
A practical monthly monitoring checklist
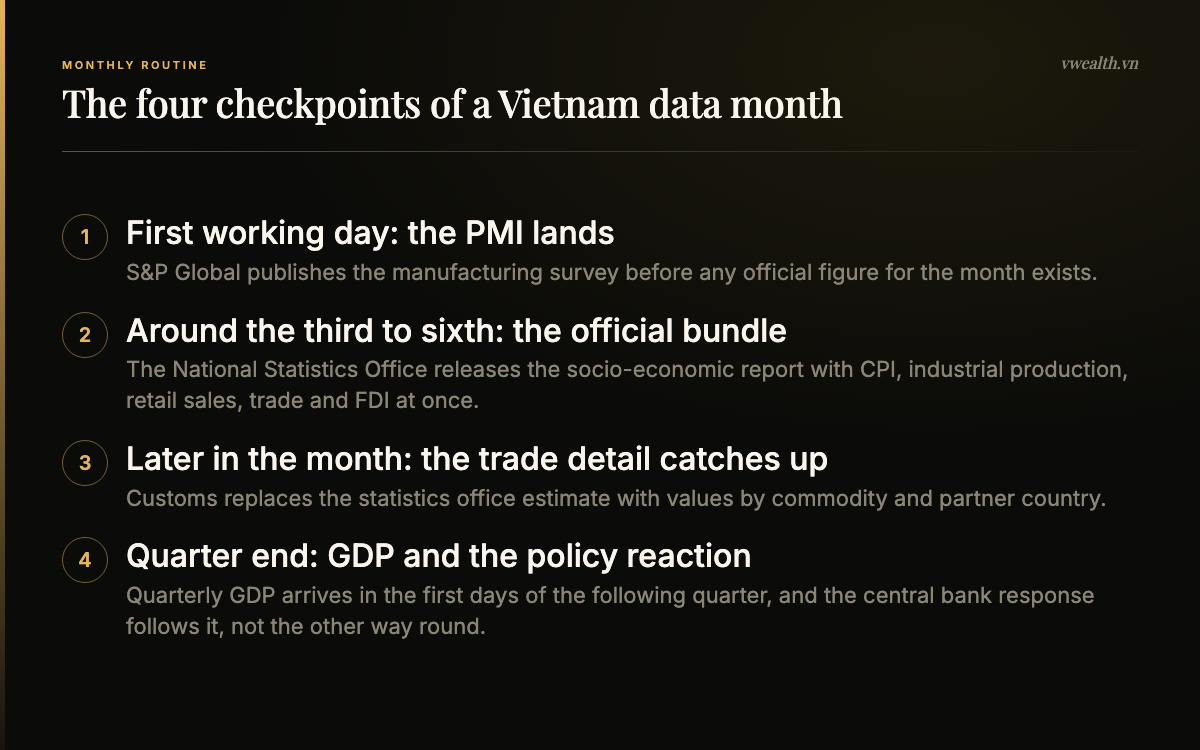
The table below is the routine. Timings are drawn from the NSO advance release calendar for 2026 and from the structure of each source; treat them as the expected pattern rather than a guarantee, and confirm against the calendar each quarter.
| When | What lands | Source | What to actually look at |
|---|---|---|---|
| First working day of the month | Manufacturing PMI for the month just ended | S&P Global | Level versus 50.0, and the direction of new export orders relative to the headline |
| 3rd of the month (6th in early 2026) | Socio-economic situation report: CPI, IIP, retail sales, trade estimate, FDI, arrivals, enterprise registrations | NSO monthly report | Disbursed FDI, not registered. Year-to-date IIP, not the single month. Core inflation alongside headline CPI |
| Same release | Consumer price index, gold price index, USD price index | NSO CPI | The year-to-date average versus the same period last year — this is the number policy is set against |
| Through the month | Detailed trade by commodity and partner, replacing the earlier estimate | Vietnam Customs | Electronics, textiles, machinery lines and the United States and China shares |
| Through the month, with a lag | Policy rates, outstanding credit, loan-to-deposit and NPL ratios, central exchange rate | State Bank of Vietnam | Credit growth since year end against the annual target, and system NPLs |
| Monthly | New investor trading accounts, foreign trading codes issued | VSDC | The monthly change, not the cumulative level |
| Daily and monthly | Index levels, turnover, foreign net buying and selling, remaining foreign room | HOSE and HNX | Foreign net flow against index direction, and room on the names you own |
| 6 January, 6 April, 3 July, 3 October in 2026 | Quarterly and annual GDP with sector breakdown | NSO release calendar | The industry and construction component, which carries the export cycle, and the vintage label |
| Occasional | Viet Nam Economic Update, Article IV staff report, Asian Development Outlook | World Bank, IMF, ADB | Forecast revisions and risk framing, not the latest data point |
Two habits make the routine work. Write the vintage next to every number you store — release date and status. And read the quarterly GDP release alongside the credit data rather than on its own, because in a bank-financed economy the credit line explains the growth line far more often than the reverse.
Reading Vietnamese data without reading Vietnamese
The honest summary of English availability is this. The National Statistics Office publishes its headline releases in English promptly and well. The exchanges and the depository publish enough in English to function. The central bank publishes its statistical tables in Vietnamese, with English confined to press material. Company-level disclosure — the annual report, the quarterly financial statements, the board resolutions that move a share price — is overwhelmingly Vietnamese, and that is a different and harder problem than macro data, which we address in reading Vietnamese company financial statements in English.
For macro work specifically, a realistic setup looks like this. Bookmark the NSO monthly report page and the release calendar. Bookmark the four SBV statistics portal pages you actually use and accept that you will run them through a translation step. Bookmark the customs statistics page for the months when commodity detail matters. Keep the World Bank API for cross-country comparison and long series, and never use it for the current quarter. Keep one aggregator for speed of charting and treat every last data point in it as unconfirmed.
Then apply the discipline that separates useful Vietnam analysis from the other kind: for every number, know the period (month or year to date), the vintage (estimate, preliminary, official) and the concept (registered or disbursed, year-to-date growth or year-on-year). Those three questions will catch almost every mistake in this article, and most of the ones in published research.
If you are still setting up market access rather than analysis, our step-by-step guide to investing in the Vietnam stock market as a foreigner covers brokers, custody and money movement, and our broader survey of Vietnam stock market data in English extends the source map from macro into market and company data. For the current cycle rather than the sources, see what investors need to know about the Vietnamese economy in 2026.
This article is analytical reference material, not investment advice; always do your own research and consider your personal risk tolerance before buying any security.
Research Vietnamese stocks in English with vwealth. Our AI-powered platform turns Vietnamese market data into full English analysis reports — with international payment support and a free 2-month trial for new accounts. Create your free account and read the latest reports.
Frequently Asked Questions
Where does official Vietnam economic data come from?
The National Statistics Office, at nso.gov.vn, is the primary source for GDP, inflation, industrial production, retail sales, foreign direct investment and the first trade estimate. The State Bank of Vietnam publishes monetary data, policy rates and the exchange rate; Vietnam Customs publishes the detailed trade file; VSDC, HOSE and HNX publish market and depository data. The World Bank, IMF and ADB restate Vietnamese data and add forecasts, but they do not generate it.
Was the General Statistics Office of Vietnam renamed?
Yes. On 26 February 2025 the Ministry of Finance issued Decision No. 384/QD-BTC setting out the functions, duties, powers and organisational structure of the National Statistics Office under the Ministry of Finance. The body founded in 1960 as the General Statistics Office is now the National Statistics Office, abbreviated NSO. The old GSO acronym still appears widely in research, database labels and even in URL paths on the office’s own site.
When is Vietnam GDP data released?
Vietnam publishes quarterly GDP within days of the quarter ending. On the 2026 advance release calendar, fourth-quarter and full-year 2025 GDP was scheduled for 6 January 2026, first-quarter 2026 for 6 April, second quarter and first half for 3 July, and third quarter and nine months for 3 October. The older convention of publishing on the 29th of the last month of the quarter, before the quarter had ended, applied through the July 2024 reference month and no longer holds.
What is the difference between registered and disbursed FDI in Vietnam?
Registered capital is committed on paper: new project registrations, adjustments to existing projects, and capital contributions or share purchases. Disbursed or implemented capital is money actually deployed. They can diverge sharply. In the first seven months of 2026, total registered inward foreign investment reached USD 38.06 billion, up 58.0% year-on-year, while disbursed FDI reached an estimated USD 15.20 billion, up 11.8%. Registered capital signals intent; disbursed capital signals activity.
Why do Vietnamese economic figures look like they always rise through the year?
Because most headline figures are cumulative year-to-date totals rather than single-month values. A release titled ‘July and seven months’ reports seven-month cumulative exports, retail sales and FDI alongside the July figures. Dropping cumulative numbers into a monthly series produces a chart that climbs all year and resets every January. Always check whether the period is the month or the year to date.
Is the Vietnam Manufacturing PMI an official statistic?
No. It is a private survey compiled by S&P Global, published at the start of the month for the month just ended, ahead of the official statistics. It is a diffusion index in which 50.0 is the no-change level, so it measures the breadth of improvement across surveyed manufacturers rather than the volume of output. It is the earliest read on manufacturing conditions, but the National Statistics Office index of industrial production is the measurement of level.
Can I rely on Trading Economics or CEIC for Vietnam data?
For charting and long series, yes; for the latest data point, be careful. Aggregators inherit the source’s revision ladder without always flagging which vintage a series carries, they often still label the source as GSO rather than NSO, and free tiers can lag the primary release. Build the chart from the aggregator if it is faster, then confirm the most recent observation against the National Statistics Office or the State Bank before acting on it.