Vietnam runs on energy the way a factory runs on electricity: quietly, constantly, and with zero tolerance for interruption. Behind every air conditioner in Ho Chi Minh City and every electronics plant in Bac Ninh sits a long industrial chain — gas fields under the sea, pipelines, power plants, refineries, and tens of thousands of petrol stations. Vietnam energy stocks let you own pieces of that chain, but here is the catch: each link earns money in a completely different way. A gas producer, a power generator, and a fuel distributor can all be labeled “energy” and still respond to the same oil price move in three opposite directions. This guide walks the entire value chain, explains who earns what and why, and shows you how to analyze each type of company before you buy a single share.
Why “energy” is not one sector but three different businesses
Open any stock screener and filter for energy in Vietnam. You will get a mixed bag: offshore drilling contractors, a gas transport monopoly, coal-fired power plants, hydropower dams, solar farms, a refinery, and the company that owns the petrol station on your street corner. Grouping them under one label is convenient for index builders, but it is dangerous for investors, because the economics of these businesses barely resemble each other.
Think of it as three distinct engines:
- Commodity-linked businesses — gas producers, drillers, oilfield service firms, and refiners. Their revenue moves with international oil and gas prices. When Brent crude rises, their selling prices rise with it, often automatically through pricing formulas written into contracts.
- Contracted businesses — power generators. They sign long-term power purchase agreements (a PPA is a multi-year contract that fixes how a plant gets paid for electricity) with the national utility. Their earnings depend on contract terms, fuel pass-through clauses, and how much they actually run — not directly on the oil price headline.
- Regulated-margin businesses — petrol and fuel distributors. The state controls retail fuel prices through a published formula. Distributors earn a defined margin per liter regardless of whether oil costs 60 or 100 dollars a barrel. Their profit driver is volume sold and cost discipline, not the commodity itself.
This single distinction — commodity-linked versus contracted versus regulated — explains most of the confusion new investors feel when they watch energy stocks. Oil jumps 20 percent and one energy stock rallies while another falls. Nothing is broken. They are simply different machines. If you are still building your foundation in this market, our primer on how to invest in the Vietnam stock market covers account setup, trading mechanics, and the market structure that all of this sits on top of.
One more piece of context before we descend into the chain. Vietnam’s energy system has a dominant character: the state. PetroVietnam (PVN), the national oil and gas group, sits upstream. Vietnam Electricity (EVN), the state utility, is the single buyer of nearly all electricity in the country — meaning almost every power plant, private or state-owned, sells to one customer. And the Ministry of Industry and Trade sets the retail price of petrol. When you buy Vietnam energy stocks, you are always, to some degree, buying a relationship with the state. That is not automatically bad — regulated businesses can be wonderfully stable — but you must know whose hand is on which lever.
The value chain: from seabed to socket, in five links
Picture the journey of a single unit of energy. Natural gas sits in a reservoir under the continental shelf off southern Vietnam — the Cuu Long and Nam Con Son basins have supplied the country for decades. Getting that gas to your phone charger involves five links, and each one hosts listed companies.
Link 1: Upstream — finding and extracting
Upstream means exploration and production: drilling wells and pumping oil or gas out of the ground. In Vietnam, the fields themselves are mostly operated by PVN and its joint ventures, which are not directly listed. What you can buy on the exchange are the service companies that upstream operators hire: drilling rig operators, offshore construction firms, survey and logistics providers. Their revenue depends on how much exploration and development activity is happening — which in turn depends on oil prices, because expensive oil makes new projects worth drilling. These stocks behave like a leveraged bet on the investment cycle: when a major new field development is approved, service firms book years of contracted work; when oil crashes and projects freeze, their rigs sit idle and day rates collapse.
Link 2: Midstream — moving and processing gas
Once gas leaves the field, someone has to pipe it ashore, process it, and deliver it to buyers. This is midstream, and in Vietnam it is dominated by one listed giant: the PVN subsidiary that owns the offshore pipelines, gas processing plants, and — since 2023 — the country’s first liquefied natural gas import terminal at Thi Vai. LNG is simply natural gas chilled to liquid form so it can travel by ship; Vietnam began importing it because domestic fields are maturing while demand keeps growing.
The midstream business model is a hybrid. Part of it is a toll road: fees for transporting gas through pipelines, largely insensitive to commodity prices. Part of it is commodity-linked: gas sold to power plants and industrial users is priced by formulas tied to international fuel oil prices, usually with a floor price that protects the seller when oil is cheap. The result is a company that benefits when oil rises but does not fully crash when oil falls — a cushioned commodity play.
Link 3: Refining — turning crude into products
Crude oil is nearly useless until a refinery converts it into petrol, diesel, jet fuel, and petrochemical feedstock. Vietnam has two major refineries: Dung Quat, operational since 2009 and listed through its operating company, and Nghi Son, which started up in 2018. A refinery earns the crack spread — the difference between the price of refined products it sells and the crude oil it buys. Note what this means: a refiner does not automatically benefit from high oil prices. It benefits from a wide gap between product and crude prices. There are historical periods when oil rose but crack spreads compressed, squeezing refiners even as upstream producers celebrated. Refining is also punctuated by maintenance shutdowns — a full plant overhaul every few years can erase a quarter or two of output, which is normal, planned, and still surprises investors every single time.
Link 4: Power generation — converting fuel into electricity
Gas, coal, water, wind, and sunlight all converge here. Vietnam’s listed power generators run gas-fired plants, coal plants, hydropower dams, and increasingly solar and wind farms. Nearly all of them sell to EVN under long-term PPAs. We will spend a full section on how these contracts pay, because they are the heart of power-sector investing.
Link 5: Distribution — the last kilometer
Finally, refined fuel reaches consumers through distribution networks. The largest listed player operates thousands of petrol stations nationwide; a second state-linked distributor also trades on the exchange. Electricity distribution, by contrast, remains inside EVN and is not separately listed — so on the stock exchange, “distribution” effectively means fuel retailing.
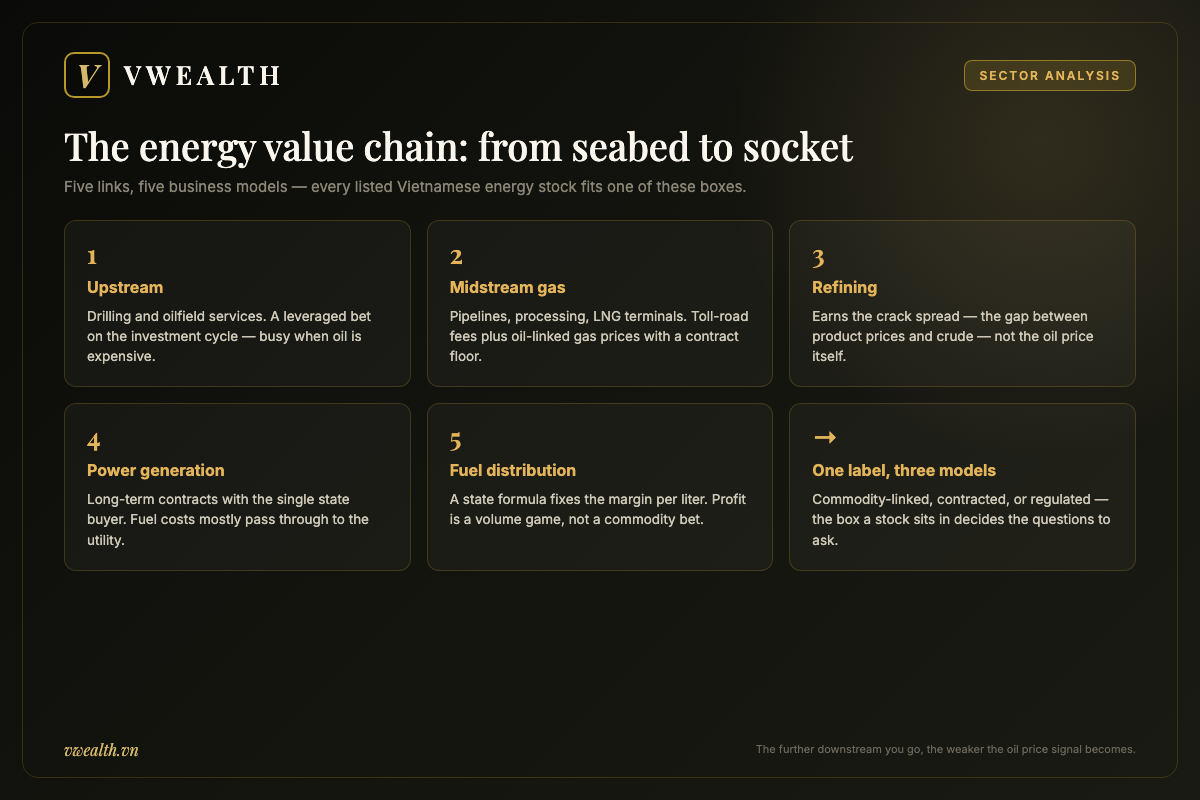
Keep this five-link map in your head. Every energy stock you will ever analyze in Vietnam slots into one — occasionally two — of these boxes, and the box determines the questions you should ask.
How gas businesses earn: oil-linked formulas with a safety net
Let us zoom into the gas chain, because it hosts some of the largest energy names on the exchange and its pricing logic confuses many newcomers.
Domestic natural gas in Vietnam is not sold at a free-market price the way gas trades in the United States. Instead, gas from each field is sold under long-term contracts whose price is set by formula. A typical structure links the gas price to a percentage of the international fuel oil price, with a contractual floor. In plain terms: when oil products get expensive globally, Vietnamese gas gets more expensive in proportion; when oil products crash, the price stops falling once it hits the agreed floor. The floor exists because developing an offshore gas field costs billions of dollars, and no one would invest without a guaranteed minimum.
Two other contract features matter enormously for earnings:
- Take-or-pay clauses. Buyers (mostly power plants and fertilizer producers) commit to purchase a minimum annual volume — and pay for it even if they do not take delivery. This stabilizes the seller’s revenue and shifts volume risk onto buyers.
- Cost pass-through. For gas-fired power plants, fuel cost is largely passed through to EVN under the PPA. This means expensive gas does not necessarily hurt the power plant’s profit — it flows through to the utility. The entity truly exposed to gas prices is the buyer of electricity, ultimately the national tariff.
Here is an illustrative example — the numbers are invented to show the mechanics, not actual figures. Suppose Gas Company A sells gas at a formula of “46 percent of international fuel oil price, floor of 5 dollars per million BTU.” If fuel oil trades at 13 dollars, the gas price is about 5.98 dollars — above the floor, so the formula applies and revenue rides the commodity. If fuel oil crashes to 9 dollars, the formula gives 4.14 dollars, below the floor — so the company still collects 5 dollars. The floor converts a commodity business into a commodity business with a parachute. When you evaluate a gas stock, your first questions should be: what fraction of volume is formula-priced versus floor-priced right now, and how close is the current price to the floor? The answers tell you how much oil upside and downside the stock actually carries.
The structural story layered on top is depletion and replacement. Vietnam’s legacy fields in the Cuu Long basin have produced for decades and are naturally declining — a mature field yields less each year, the way a squeezed orange gives less juice. The country’s answer is twofold: develop new domestic fields and import LNG through new terminals. The flagship domestic project is Block B–O Mon in the southwest, a roughly 12-billion-dollar integrated gas-to-power chain that took its long-awaited final investment decision in March 2024, with first gas targeted around the end of 2026 to feed a cluster of power plants in the Mekong Delta. On the import side, PV Gas launched Vietnam’s first LNG import terminal at Thi Vai (about one million tonnes per year of capacity) in late 2023, receiving its commissioning cargo in July 2023. For midstream companies, both answers are growth: new fields need new pipelines, and imported LNG needs terminals, storage, and regasification — all fee-earning infrastructure. For investors, the gas story in Vietnam is less “bet on the oil price” and more “bet on the buildout of gas infrastructure for a power-hungry economy,” with oil price as the seasoning rather than the meal.
How power generators earn: the anatomy of a PPA
Power generation is where contracted economics replace commodity economics, and it rewards a different kind of analysis. Since EVN buys essentially all grid electricity, a power plant’s profitability is written into its power purchase agreement years before you ever buy the stock.
A typical thermal-plant PPA in Vietnam splits payment into two streams:
- Capacity payment (fixed). The plant is paid for being available — for existing, being maintained, and standing ready — whether or not it runs at full tilt. This portion covers the plant’s construction debt and fixed costs. It is the “rent” component.
- Energy payment (variable). The plant is paid per kilowatt-hour actually generated, at a rate designed to cover fuel and variable operating costs. Fuel cost is usually passed through, so a spike in coal or gas prices raises revenue and costs together, roughly canceling out.
On top of the PPA sits the competitive generation market, Vietnam’s wholesale electricity market, where plants offer part of their output at market prices. Each year a plant is assigned a contracted volume (often called Qc); generation within that volume earns contract prices, while output beyond it earns market prices, which swing with supply and demand. In hot, dry years when demand surges and hydropower reservoirs run low, market prices can spike — and thermal plants with spare capacity enjoy a bonus. In cool, wet years the opposite happens.
The fuel type determines the personality of the stock:
Hydropower: the weather business
A dam’s fuel is free — rain. Once construction debt is repaid, a hydro plant is a cash machine with tiny operating costs. The catch is hydrology: output depends on rainfall, which follows multi-year climate cycles. During La Niña phases (the Pacific climate pattern that brings Vietnam heavier rain), reservoirs brim and hydro stocks report bumper output. During El Niño phases, rivers thin out and generation can drop sharply. A hydro stock is therefore a bond-like asset with a weather-driven coupon: predictable over a decade, lumpy year to year. Never judge a hydro company on a single year’s earnings — you may be looking at the wet peak or the dry trough of a cycle.
Coal and gas thermal: the contract business
Thermal plants live and die by their PPA terms, their assigned contract volume, and their ability to stay online. The analytical work is reading contract structures and maintenance schedules, not forecasting commodities — the fuel pass-through mostly neutralizes those. The main long-term risk is policy: Vietnam committed at COP26 in 2021 to net-zero emissions by 2050, and national power planning has since pointed away from new coal. Existing coal plants will run for years — the grid needs them — but they are mature assets in gentle sunset, best analyzed for dividend yield rather than growth.
Renewables: the policy business
Vietnam experienced one of Asia’s most explosive solar booms in 2019–2020, triggered by a generous feed-in tariff — a fixed, above-market price the state guaranteed for 20 years to early solar projects. Capacity mushroomed so fast that the grid in some south-central provinces could not absorb it all, and some farms faced curtailment, meaning the grid operator ordered them to cut output even though the sun was shining. The episode teaches the core lesson of renewable investing in Vietnam: the economics are made and unmade by policy. A project with a locked-in tariff is a quasi-bond; a project waiting for a pricing mechanism is a question mark. When you analyze a renewables stock, sort its portfolio into those two buckets before doing anything else.
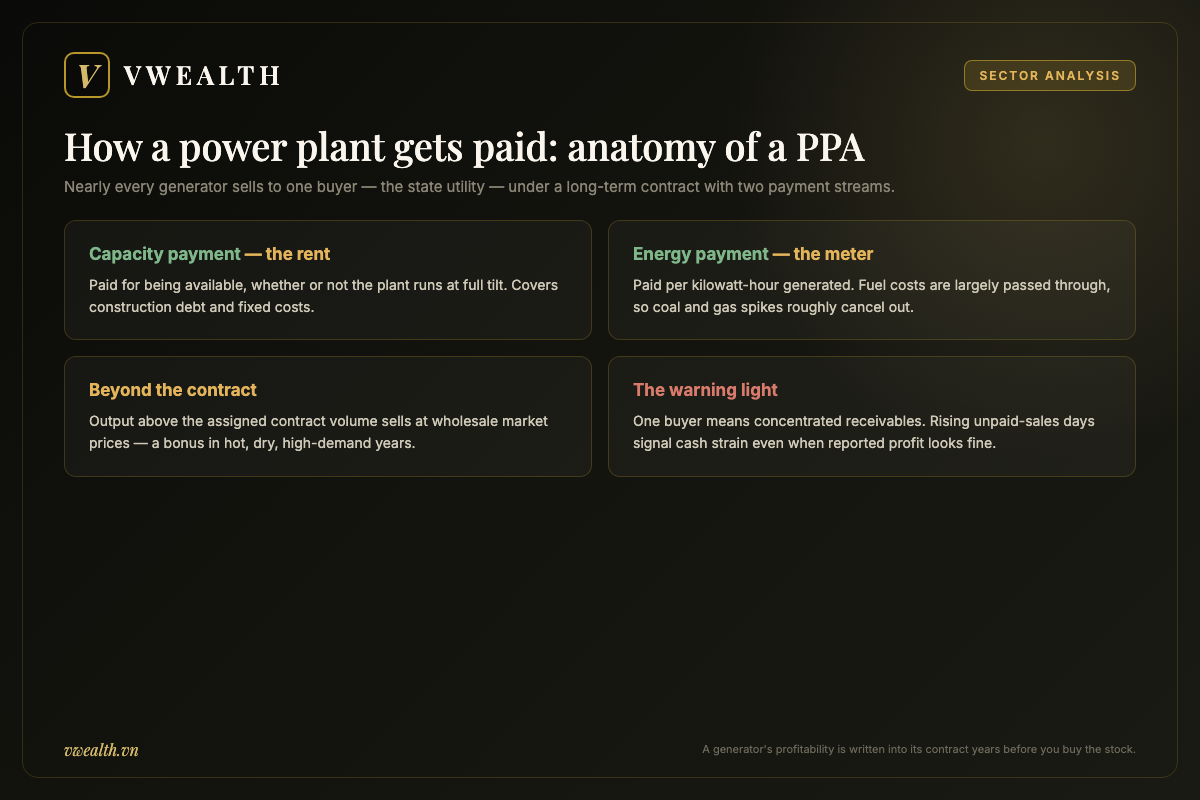
One more power-sector item deserves its own paragraph: receivables from EVN. Since the utility is a single buyer, every generator’s accounts receivable is concentrated in one customer. In years when EVN sells electricity below its own cost — retail tariffs are politically sensitive and adjust slowly — the utility’s finances strain, and it can slow payments to generators. The generators’ income statements may look fine while their cash flow statements quietly deteriorate. Checking receivable days (how many days of sales sit unpaid) is not optional in this sector; it is the difference between owning earnings on paper and earnings in cash. Our guide on investing in Vietnamese equities explains where to find these statements and how foreign investors can access company filings.
How fuel distributors earn: a margin set by decree
Now for the strangest business model of the three — strange, at least, to anyone trained on free-market energy retailing. In Vietnam, the retail prices of petrol and diesel are set by the state through a published base-price formula, reviewed on a regular cycle of a few days to a week. The formula stacks up the components: international product price (Vietnam’s benchmark is the Singapore trading hub), freight and insurance, import duties and taxes, standard business costs, and a defined profit margin per liter for the distribution system. On top sits a price stabilization fund — a buffer the state can fill (by adding a small levy to each liter) or drain (by subsidizing prices) to smooth out global price shocks.
Read that again and notice what it implies: the distributor’s per-liter profit is essentially an administrative decision. Whether Brent trades at 60 or 110 dollars, the formula hands the distribution system a similar margin per liter sold. The business is therefore a volume game: profit grows when Vietnam consumes more fuel — more motorbikes upgraded to cars, more trucks on new expressways, more flights — and when the company grabs market share or squeezes costs out of its logistics.
So why do fuel distribution stocks still wobble when oil moves? Two mechanical reasons:
- Inventory gains and losses. A distributor always holds weeks of fuel inventory, since regulations require minimum stockpiles. When world prices fall faster than the domestic price cycle adjusts, the company sells fuel bought at yesterday’s high prices into today’s lower retail price — booking an inventory loss. When prices rise, the reverse produces a windfall gain. These swings are noise around the volume-driven core, but in any single quarter they can dominate reported profit. An experienced investor mentally strips them out; a beginner mistakes them for the trend.
- Demand elasticity. Very expensive fuel eventually trims consumption growth, touching the volume engine itself — though in a motorizing economy like Vietnam, this effect has historically been mild and temporary.
Illustrative example, invented numbers: Distributor B sells 10 billion liters a year at a formula margin of 300 dong per liter — a stable core of 3,000 billion dong. In a quarter when global prices dropped sharply, it books an inventory loss of 800 billion dong; the headline collapses and the stock sells off. Two quarters later prices rebound, it books an 800 billion gain, and headlines celebrate a “profit surge.” The core business did nothing but grow volume 5 percent the entire time. Your job as an analyst is to see the 3,000, not the 800.
The long-term questions for fuel distributors are structural. Vehicle electrification will someday bend the petrol demand curve — someday, though motorbike-dominated Vietnam is earlier on that curve than Western markets, and distributors with prime station real estate can convert sites into charging and convenience retail. Meanwhile, the near-term story is formalization: the state has tightened invoicing and quality enforcement, which pressures small informal traders and pushes volume toward large compliant networks. Regulation, for once, works in the incumbents’ favor.
One oil price, four different outcomes: tracing the transmission
Here is the exam question this entire article has been building toward. Brent crude rises 30 percent over six months. What happens to each link of the Vietnamese energy chain?
| Segment | Revenue driver | Effect of rising oil | Effect of falling oil | Key thing to check |
|---|---|---|---|---|
| Oilfield services and drilling | Upstream investment activity | Positive with a lag — new projects get approved, day rates firm up | Negative with a lag — projects deferred, fleets idle | Contract backlog, rig utilization |
| Gas production and midstream | Oil-linked formula prices plus transport fees | Positive and fairly quick — formula prices rise | Cushioned — floor prices limit the damage | Distance between market price and contract floor |
| Refining | Crack spread (product minus crude) | Ambiguous — depends on whether product prices rise faster than crude | Ambiguous, plus inventory losses on the crude it holds | Regional crack spreads, maintenance calendar |
| Power generation | PPA capacity and energy payments | Roughly neutral — fuel cost passes through to the buyer | Roughly neutral | Contract volume, dispatch, receivables |
| Fuel distribution | Regulated margin × liters sold | Short-term inventory gains; mild long-term demand drag | Short-term inventory losses; mild demand support | Underlying volume growth, cost per liter |
Notice the pattern: the further downstream you travel, the weaker the commodity signal becomes. Upstream services feel oil with full force. Gas producers feel it with a parachute. Refiners feel a different variable entirely. Generators barely feel it. Distributors feel only its second-order tremors. This is why “oil is up, buy energy stocks” is one of the laziest and most expensive shortcuts in this market — half the sector does not care about oil, and a quarter of it can be hurt by the very move that helps the rest.
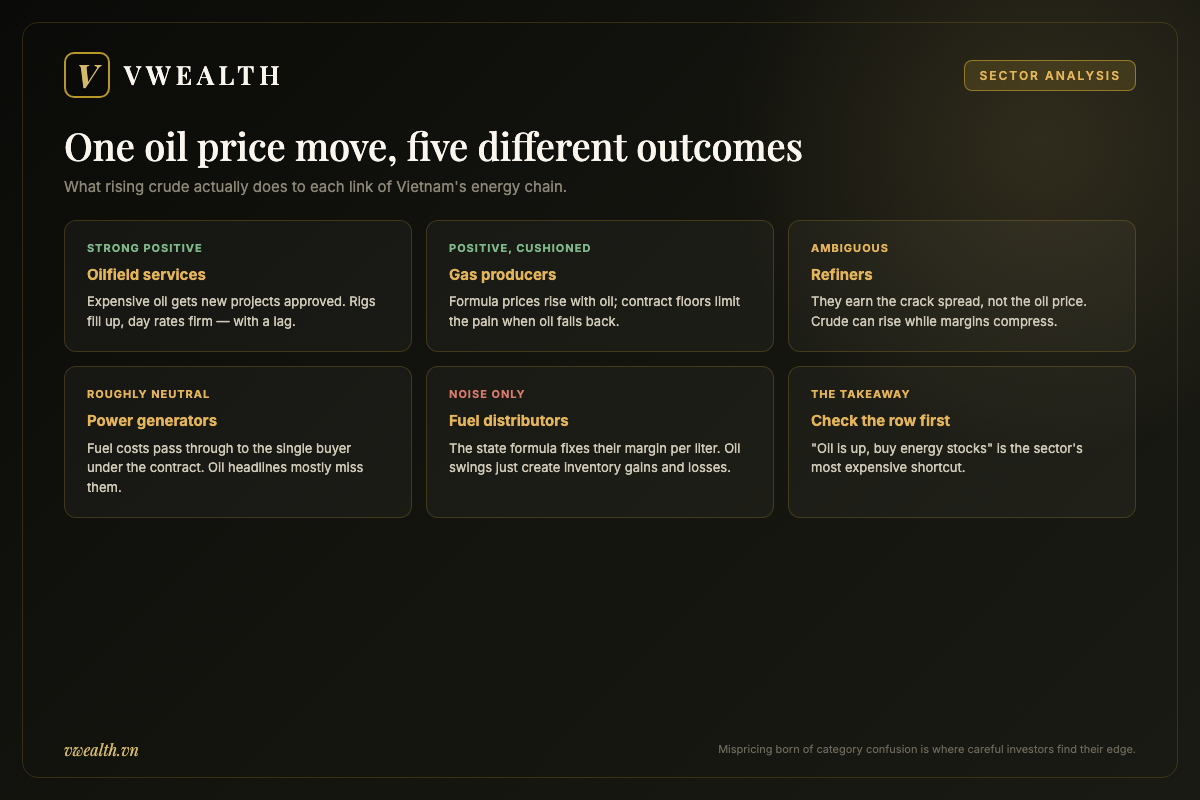
A practical habit: whenever an energy stock moves sharply on an oil headline, ask which row of the table it belongs to. If a power generator with full fuel pass-through rallies 15 percent because crude spiked, the market is misfiling it — and mispricing born of misfiling is exactly where careful investors find their edge. This is the same category-confusion dynamic we describe in the steel and industrial sector guide, where companies at different points of the metals chain get lumped together and mispriced as one block.
The structural engine: electricity demand that refuses to slow down
Commodity cycles are the waves; electricity demand is the tide. And Vietnam’s tide has run one direction for a generation.
For most of the past two decades, Vietnam’s electricity consumption grew at high single-digit to double-digit annual rates — persistently faster than GDP. The rule of thumb long used in national planning was that power demand grows at well above one times GDP growth; historically the elasticity ratio hovered around 1.7 to 2, meaning consumption outpaced the economy by a wide margin — a relationship typical of economies in their heavy industrialization phase. The drivers are visible from any highway: manufacturing plants absorbing relocated supply chains, urbanization pulling millions into air-conditioned apartments, and rising incomes turning fans into air conditioners and bicycles into electric motorbikes. Manufacturing matters most — energy-hungry industries like steel, cement and industrial materials consume electricity on a scale households never approach, and each new industrial park adds demand equivalent to a small city. One recent wrinkle is worth noting: in 2025 that historic pattern briefly loosened, with commercial power output rising about 4.9 percent while GDP grew roughly 8 percent — the elasticity ratio dipping below 1 for the first time, partly because self-generated rooftop solar (an estimated 10 billion kWh) quietly met demand that never showed up on the grid. It is a reminder that the tide, while powerful, is not a straight line, and that behind-the-meter solar is starting to reshape how much of the growth the listed grid-supplying companies actually capture.
Why does this matter more than any quarterly earnings beat? Because in a power system, demand growth is destiny. Every percentage point of consumption growth must be met with new generation, new transmission lines, and new fuel supply — or the lights flicker. Northern Vietnam’s power shortages during the hot, dry early summer of 2023, when low reservoirs collided with a heat wave and some industrial zones faced rotating cuts, made the equation vivid for every policymaker and factory owner in the country. Shortage is politically and economically intolerable; therefore capacity will be built; therefore the companies that build, fuel, and operate that capacity have a structural order book measured in decades.
For investors, the demand tide shows up in three distinct ways:
- Generators get volume security. In a system running close to its limits, efficient plants get dispatched — their output is wanted. Contract volumes are more likely to be filled, and surplus output finds buyers at market prices.
- Infrastructure builders get a pipeline. Power construction firms, electrical equipment makers, and grid contractors monetize the buildout itself, earning from capacity additions regardless of which fuel wins.
- Fuel suppliers get a growing customer. More gas-fired capacity means more gas demand, underwriting the LNG terminals and domestic field developments discussed earlier.
This structural demand story is also part of why foreign institutional money keeps circling Vietnamese utilities and energy infrastructure. As the market progresses along the path we map in our guide to Vietnam’s journey from frontier to emerging market status, index inclusion and deeper foreign participation tend to favor exactly this kind of large, asset-heavy, structurally growing sector. Energy and utilities are classic first purchases for emerging-market funds: easy to understand, tied to national growth, and big enough to absorb institutional order sizes.
The energy transition: reading policy direction without pretending to know the timetable
Every energy investor in Vietnam eventually confronts the transition question: what happens to gas, coal, and petrol businesses in a decarbonizing world? The honest answer has two parts — a clear direction and an unclear speed.
The direction is set at the highest level. Vietnam pledged net-zero emissions by 2050 at the COP26 summit in 2021. The national power development plan first approved in 2023 — known as PDP8, the eighth master plan for the power sector — translated that pledge into planning language: no new coal plants beyond those already in the pipeline, coal generation phased down over the following decades, aggressive expansion of offshore and onshore wind, continued solar growth, and a major near-term role for gas — both domestic fields and imported LNG — as the bridge fuel that keeps the grid stable while renewables scale. That direction was reinforced, not reversed, when the government issued a revised PDP8 in April 2025 (Decision 768/QD-TTg): the update pushes renewables to roughly 28–36 percent of the generation mix by 2030 and around 74–75 percent by 2050, dials solar capacity up several-fold, and keeps LNG-fired power at roughly 10–12 percent of capacity by 2030 as the gas bridge. Vietnam also signed a Just Energy Transition Partnership — a 15.5-billion-dollar financing package agreed in December 2022 with a group of developed economies — attaching international money to the coal phase-down, though disbursement has moved slowly.
The speed, however, is where humility is required. Transition timelines everywhere slip and lurch: pricing mechanisms for new renewable projects take years to finalize, LNG-to-power projects involve billion-dollar negotiations over who bears fuel-cost risk, and grid investment must race ahead of generation for any of it to work. An investor who bet everything on the fastest imaginable timeline has repeatedly been early — which, in markets, is a polite word for wrong. The sensible posture is to treat the direction as investable and the timetable as unknowable.
What does that posture look like in a portfolio? A few practical translations:
- Gas is the transition’s quiet winner. Every plan that phases down coal while renewables scale leans on gas-fired generation for grid stability — gas plants can ramp up quickly when the sun sets or wind dies. Companies that produce, import, transport, and burn gas own the bridge the whole system must cross.
- Renewables need a bankable price to be a business. Sunshine is free, but solar farms are built with debt, and debt needs predictable revenue. Watch for durable pricing mechanisms — auctions, direct power purchase agreements allowing factories to buy clean power straight from producers, revised tariffs. Each mechanism that hardens turns speculative capacity into contracted cash flow.
- Coal assets become yield vehicles, not growth stories. Existing plants will run for years and can pay handsome dividends, but their terminal value shrinks. Price them as bonds with an expiry, not as compounding machines.
- Grid and construction are fuel-agnostic. Whichever generation technology wins, someone strings the wires and pours the concrete. The buildout itself is the safest way to own the transition.
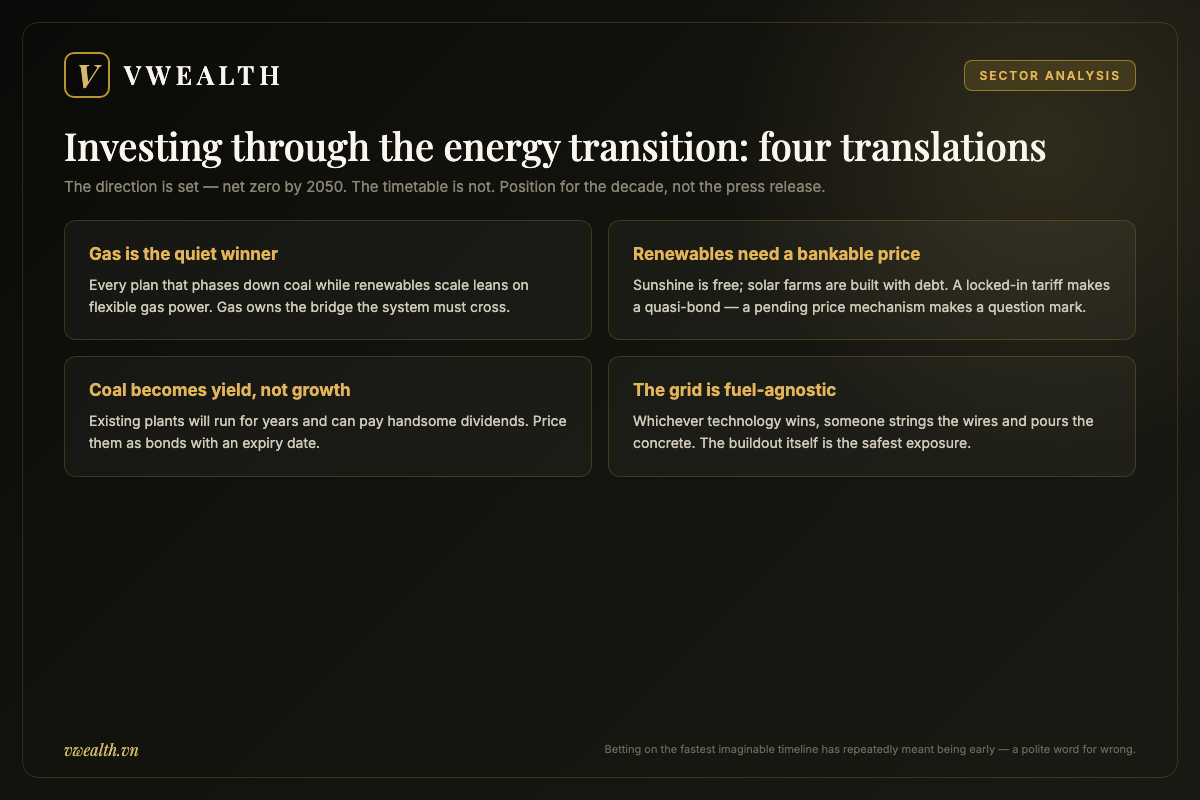
A note on what not to do: do not try to trade policy announcements. Planning documents are revised, implementation decrees follow months later, and the market’s first reaction to a policy headline is frequently reversed once details emerge. Position for the decade, not the press release.
Analyzing an energy stock: the right questions for each link
By now the framework should be clear: the segment determines the questions. Here is the working checklist, link by link, that turns this article into an actual analysis process.
For gas and midstream companies
- What share of revenue is fee-based (pipelines, terminals) versus commodity-linked (gas sales)? Fee revenue deserves a higher valuation multiple because it is steadier.
- Where are current selling prices relative to contract floors? Near the floor means limited downside and full upside; far above the floor means symmetric commodity exposure.
- What is the volume outlook — are supplying fields declining, and are replacement projects (new fields, LNG terminals) approved and funded?
- How large is the capital expenditure program, and how is it financed? Infrastructure buildouts suppress free cash flow for years before paying off.
For power generators
- What are the PPA terms — how much revenue is fixed capacity payment versus variable energy payment, and when do key contracts expire or reprice?
- For hydro: where is the region in the wet-dry climate cycle, and what does a normalized (multi-year average) output look like?
- For thermal: what contract volume was assigned, and is the plant competitive enough to sell beyond it at market prices?
- How fast is the company collecting cash from EVN? Rising receivable days are the sector’s earliest warning light.
- What is the debt profile? Power plants are built with heavy leverage; a plant nearing full repayment is about to convert earnings into distributable cash.
For refiners
- What are regional crack spreads doing — not oil prices, crack spreads?
- When is the next scheduled major maintenance, and has the market priced the output gap?
- How much inventory does the company hold, and what price swings occurred during the reporting period?
For fuel distributors
- What is underlying volume growth, stripped of inventory gains and losses?
- Is market share shifting toward large formal networks — and is this company one of them?
- What non-fuel income (convenience retail, lubricants, aviation fueling, real estate on station land) is developing? These streams diversify away from the regulated margin.
On valuation: use different tools for different links. Commodity-linked names are often valued on cycle-normalized earnings — average the good and bad years, because valuing a cyclical on peak earnings is how investors buy tops. Contracted generators suit dividend-discount and cash-flow approaches, since their revenue is contractual. Distributors suit earnings multiples on volume-driven core profit. A single price-to-earnings ratio applied across the whole sector will systematically mislead you — a cheap-looking refiner at the top of the crack-spread cycle can be far more expensive than an optically pricier hydro plant entering a wet phase.
Doing this segment-by-segment work manually — pulling filings, separating inventory noise from core margin, tracking receivables across a dozen power companies — is genuinely time-consuming. This is precisely the workload vwealth automates: the platform’s AI reads each company’s Vietnamese financial statements and produces full English analysis reports with the segment context built in. You can create a free account and pull up any listed energy name’s current numbers rather than reconstructing them by hand.
Risk map: what actually goes wrong in this sector
Every sector has its characteristic accidents. Here are the ones that recur in Vietnamese energy, roughly ordered by how often they surprise investors.
| Risk | Who it hits hardest | How it shows up | How to monitor it |
|---|---|---|---|
| Policy and tariff decisions | Renewables, distributors, generators | Delayed pricing mechanisms, margin formula revisions, tariff freezes | Ministry of Industry and Trade circulars, power plan revisions |
| Single-buyer credit strain | All generators | Receivables ballooning while reported profit looks healthy | Receivable days in quarterly statements |
| Hydrology cycles | Hydro plants; thermal plants inversely | Output swings of tens of percent between wet and dry years | Reservoir levels, El Niño / La Niña forecasts |
| Commodity downcycles | Upstream services, gas producers | Project deferrals, prices falling toward contract floors | Oil price versus floor levels, project approval news |
| Execution and construction delay | LNG and new-build power projects | Multi-year slips in commercial operation dates, cost overruns | Project milestone announcements, capex versus plan |
| Currency exposure | Importers and dollar-indebted plants | Foreign-exchange losses when the dong weakens against the dollar | Share of dollar debt and dollar-priced fuel costs in filings |
| Inventory whiplash | Refiners, distributors | Headline profit swings unrelated to core business | Strip inventory effects out of every quarterly result |
Two of these deserve emphasis because they are peculiar to Vietnam’s structure. First, the single-buyer system concentrates counterparty risk in a way diversified markets never experience — the financial health of the utility is a systemic variable for the entire generation sector, worth checking even when your specific company reports beautiful numbers. Second, currency: much of the energy chain is dollarized — imported LNG is dollar-priced, major power projects carry dollar debt, equipment is imported — while revenue is earned in dong. A weakening dong quietly transfers value from these companies to their foreign creditors and suppliers, and the loss surfaces in the financial-income line where inattentive readers miss it.
None of these risks is a reason to avoid the sector. They are reasons to size positions sensibly, diversify across segments rather than doubling up on one link of the chain, and read cash flow statements with the same attention most investors reserve for headlines. A portfolio holding a gas infrastructure name, a hydro generator, and a fuel distributor contains three nearly uncorrelated business models that happen to share a sector label — genuine diversification hiding inside a single industry.
Putting it together: a decade-long thesis with quarterly noise
Step back from the mechanics and the shape of the opportunity becomes simple. Vietnam is an industrializing, urbanizing country of about a hundred million people whose demand for electricity and mobility has compounded relentlessly for a generation and has no credible reason to stop. Meeting that demand requires an enormous, multi-decade buildout: new gas fields and import terminals, new power plants across every technology, a transmission grid racing to keep up, and a fuel distribution network consolidating into modern hands. The listed energy sector is the investable surface of that buildout.
At the same time, the sector’s quarterly reality is noisy in ways that shake out unprepared investors: oil prices whipsaw the upstream names, weather whipsaws the dams, inventory accounting whipsaws the distributors, and policy headlines whipsaw everything. The investors who compound in this sector are the ones who can tell the tide from the waves — who know which business model they own, which variables actually drive it, and which scary headline is merely the other segments’ problem.
The framework from this guide travels well. Ask of any Vietnam energy stock: Which link of the chain is this? Is its revenue commodity-linked, contracted, or regulated? What is the one variable that moves its cash flow — the oil-to-floor gap, the PPA terms and hydrology, the crack spread, or liters sold? And is the market currently pricing it off the right variable, or off a headline that belongs to a different link? When the answer to that last question is “the wrong variable,” you have found what this sector reliably produces for patient analysts: mispricing born of complexity.
This article is a reference framework, not investment advice — always verify current figures and consult the latest company filings before making any investment decision.
Research Vietnamese stocks in English with vwealth. Our AI-powered platform turns Vietnamese market data into full English analysis reports — with international payment support and a free 2-month trial for new accounts. Create your free account and read the latest reports.
Frequently Asked Questions
What are Vietnam energy market stocks?
They let you own pieces of a long industrial chain: gas fields under the sea, pipelines, power plants, refineries and tens of thousands of petrol stations. Behind every air conditioner in Ho Chi Minh City and every electronics plant in Bac Ninh sits some part of that chain.
Is energy one sector or several?
Several, and treating it as one is the classic mistake. A gas producer, a power generator and a fuel distributor can all be labelled energy and still respond to the same oil price move in three opposite directions, because each link earns money in a completely different way.
How does the oil price affect Vietnamese energy stocks?
Differently at each link. Upstream producers generally gain when prices rise, while downstream distributors can be squeezed by the same move — which is why knowing where a company sits in the value chain matters more than knowing the oil price forecast.
Which energy companies are most stable?
Stability depends on whether revenue is tied to a regulated tariff or to a floating commodity price. The further a business sits from direct commodity exposure, the steadier its earnings tend to be — and the less it benefits when prices spike.
How should I analyse a Vietnam energy stock before buying?
Start by placing it on the value chain, then work out what it actually gets paid for and what input it is exposed to. Only after that do the financials mean anything, because the same ratio reads differently for a gas producer than for a petrol retailer.