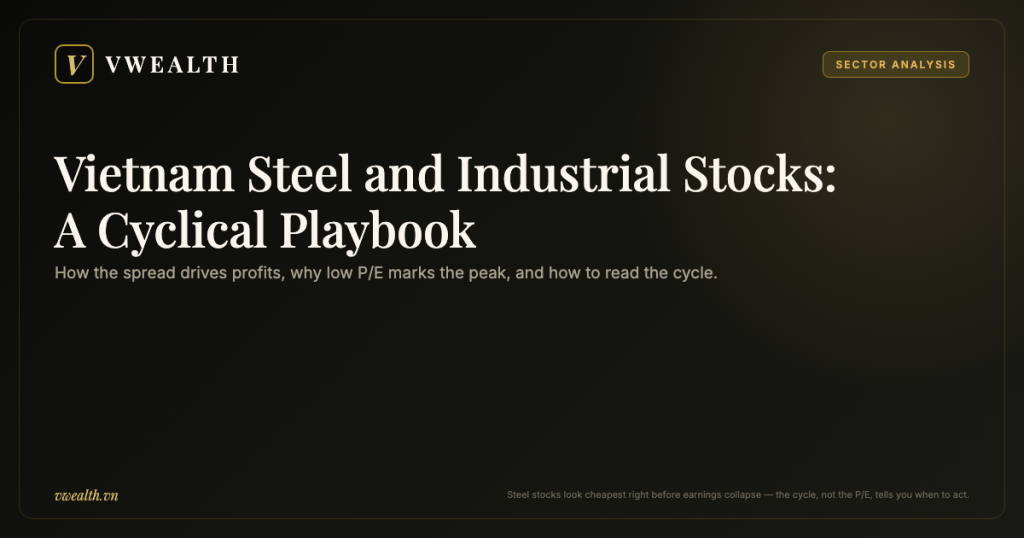
Steel stocks are the market’s most seductive trap. At the top of the cycle they post record profits, trade at single-digit P/E ratios, and look like the cheapest stocks on the exchange — right before earnings collapse. At the bottom they bleed losses, look hopelessly expensive, and quietly set up the best returns of the next five years. The Vietnam steel industry runs on this same brutal rhythm, amplified by a construction-heavy economy, a wave of capacity expansion, and trade politics that can redraw the profit map in a single ruling. This playbook explains how steel and industrial companies actually make money, why the P/E ratio lies to you at both ends of the cycle, and how to read where the cycle sits before you commit a single dong.
Steel Is a Price-Taker Business — and That Changes Everything
Start with the single most important fact about the Vietnam steel industry: no steel company sets its own selling price. Steel is a commodity — a product so standardized that a ton of hot-rolled coil from one mill is interchangeable with a ton from another. When products are interchangeable, buyers simply pick the lowest price, and the price of every producer converges toward a regional benchmark that no single company controls. Economists call firms in this position “price takers”: they take the market price as given and can only decide how much to produce and how cheaply.
Contrast this with a consumer company. A dairy producer with a beloved brand can raise prices a few percent a year and customers stay. A software firm can charge for features competitors lack. A steel mill has no such lever. If the regional price of construction steel falls 20 percent, the mill’s selling price falls roughly 20 percent whether its product is excellent or merely adequate. Revenue is hostage to a global commodity market shaped by Chinese supply, global construction demand, and freight rates.
Vietnam matters in this story more than its size suggests. The country has grown into the largest steel producer in Southeast Asia, with integrated mills capable of making hot-rolled coil — the flat steel used in pipes, appliances, and car bodies — alongside a long tail of producers making construction steel, galvanized sheet, and steel pipe. The scale is now globally material: Vietnam produced roughly 22 million tonnes of crude steel in 2024 (up almost 15 percent on the prior year) and, on 2025 figures, entered the world’s top ten steel-producing nations for the first time, according to World Steel Association data reported by Vietnamese state media. That scale means Vietnamese steel is exported across ASEAN, to Europe, and to the United States, which plugs the sector directly into global price swings and, as we will see later, global trade disputes.
For an investor, “price taker” has one giant consequence: profits are cyclical by design, not by accident. When demand runs ahead of supply, prices and margins soar together, and every mill prints money. When supply runs ahead of demand — which it always eventually does, because high profits attract new furnaces — prices sag below the cost of the weakest producers and profits evaporate. The company did not become smarter at the top or dumber at the bottom. The cycle did the work. If you are new to the Vietnamese market and want the basic mechanics of accounts, tickers, and trading hours before diving into sector analysis, start with this guide to investing in the Vietnam stock market, then come back — because cyclicals are where those basics get stress-tested.
The Spread: Where a Steel Company’s Profit Actually Comes From
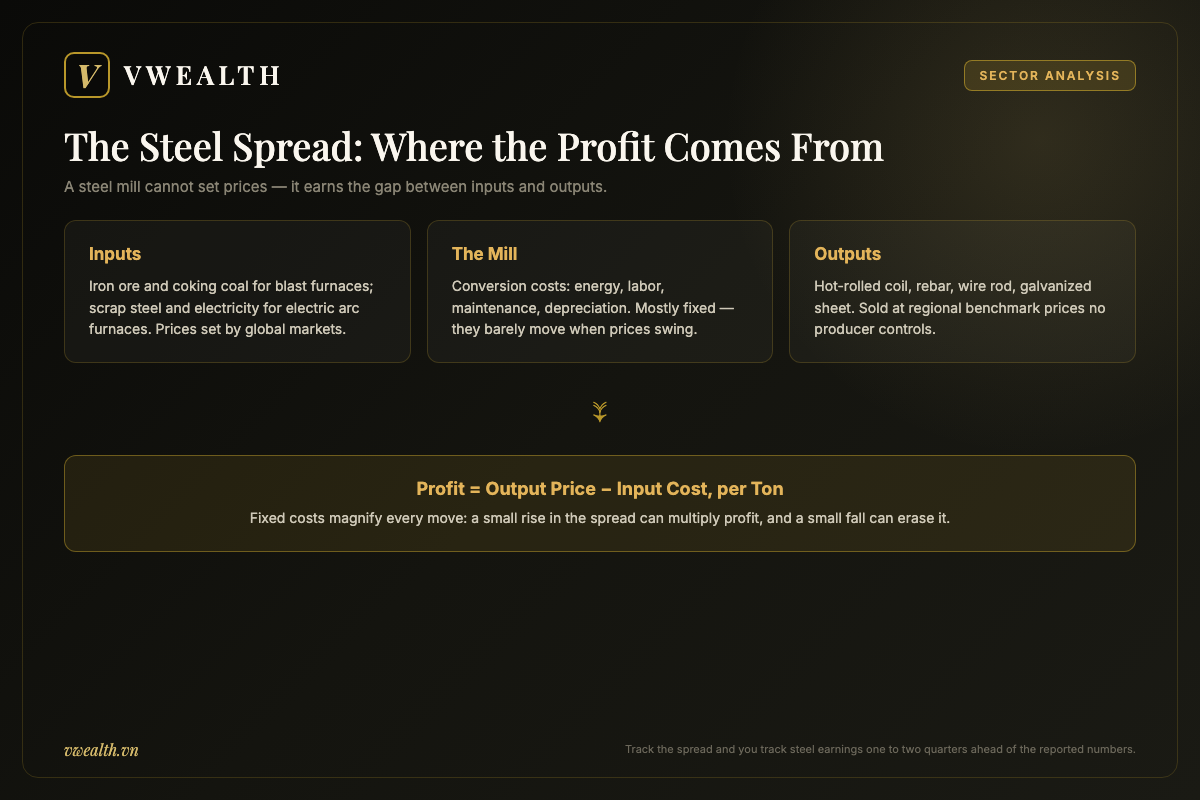
If a steel company cannot control its selling price, where does profit come from? The answer is the spread: the gap between the price of finished steel going out the gate and the cost of raw materials coming in. Everything else — volume, efficiency, debt — matters, but the spread is the engine.
A blast-furnace mill buys two main inputs: iron ore (the rock that contains the metal) and coking coal (a special coal baked into coke, the fuel and chemical agent that strips oxygen from the ore). It sells hot-rolled coil, rebar for construction, wire rod, and other finished products. Illustrative example — the numbers are made up to show the mechanics, not to describe any real company: suppose making one ton of steel requires ore and coal costing a combined $420, plus $130 of conversion costs (energy, labor, electrodes, maintenance, depreciation). If hot-rolled coil sells at $620 a ton, the mill earns roughly $70 per ton. Now let the steel price rise 10 percent to $682 while input costs stay flat: profit per ton jumps from $70 to $132 — an 89 percent increase in profit from a 10 percent move in price. That violent multiplication is called operating leverage, and it is why steel earnings can double or halve within a few quarters.
The same math runs in reverse. If steel falls 10 percent while ore and coal hold firm, that $70 of profit becomes $8. A slightly deeper fall pushes the mill into losses on every ton it ships. When you see a Vietnamese steel company swing from record quarterly profit to a loss within a year, this spread arithmetic — not management failure — is usually the whole explanation. Vietnam’s own 2021–2022 cycle is the textbook case. The country’s largest steelmaker earned a record net profit of roughly 34 trillion dong in 2021, then, as global steel prices rolled over and input costs stayed high, swung to a quarterly loss of about 1,786 billion dong in the third quarter of 2022 — versus a profit above 10 trillion dong in the same quarter a year earlier — and finished 2022 with full-year net profit down around three-quarters. Smaller peers such as Nam Kim and the state-owned VNSteel slid from large 2021 profits into outright 2022 losses over the same window. Nothing about those companies’ factories changed; the spread did.
Two ways to make steel, two different cost machines
Not all mills face the same spread. Integrated producers use the blast furnace–basic oxygen route (BOF), which turns ore and coke into new steel. Their profit tracks the gap between steel prices and the ore-plus-coal basket. Electric arc furnace producers (EAF) melt scrap steel with electricity instead. Their spread depends on scrap prices and power tariffs. The two models diverge at interesting moments: when ore and coal spike but scrap lags, EAF mills gain a temporary cost edge, and vice versa. When you compare two Vietnamese steel stocks, first ask which route each uses — you may be comparing two different businesses that happen to share an industry name.
The inventory time bomb
One more wrinkle makes quarterly numbers deceptive. Mills hold months of raw-material inventory bought at past prices. When steel prices fall fast, a mill spends a quarter or two selling cheap finished product made from expensive old ore — margins get crushed twice. Accountants then force a markdown called an inventory provision, dumping the loss into a single ugly quarter. The mirror image happens in recoveries: cheap old inventory meets rising selling prices, and margins look briefly miraculous. Neither extreme reflects the mill’s true steady-state profitability. Seasoned cyclical investors mentally smooth two or three quarters together before judging anything.
Who Buys Vietnamese Steel: Construction, Public Money, and Exports
Spreads tell you how profit is made per ton; demand tells you how many tons get sold. Vietnamese steel demand rests on three pillars, and each moves on its own clock.
Pillar one: private construction and real estate
The largest chunk of domestic steel — rebar, wire rod, galvanized roofing — goes into buildings. That chains steel demand directly to the property cycle: when developers launch projects, steel orders arrive six to eighteen months later as foundations rise. When credit tightens and project approvals stall, steel demand fades with the same lag. This is why steel stocks and property stocks often rhyme, with steel lagging slightly. If you invest in one sector, you should understand the other; our companion piece on Vietnamese real estate stocks and the property cycle covers the developer side of this exact linkage — presales, project pipelines, and the credit conditions that switch construction on and off.
Pillar two: public investment
The second pillar is the state. Highways, airports, power transmission, and metro lines consume enormous tonnages of construction steel, and public investment in Vietnam often accelerates precisely when the private property market cools, because the government uses infrastructure spending to support growth. For a steel investor this is a partial hedge: a weak year for developers can be offset by a strong year of public disbursement. The keyword is disbursement — budgets are announced loudly, but steel is only ordered when money actually flows to contractors and machines actually move earth. Watching actual disbursement figures rather than headline budget plans is one of the simplest edges available in this sector.
Pillar three: exports
The third pillar connects Vietnam to the world. Vietnamese mills export hot-rolled coil, galvanized sheet, and pipe across ASEAN, to the EU, and to North America. Exports let mills run furnaces at high utilization even when domestic demand is soft — a furnace running below capacity still burns most of its fixed costs, so extra export tons at thin margins can still be rational. But exports also import volatility: global prices, ocean freight, currency moves, and above all trade policy. A single anti-dumping ruling in a major destination can shut a door that took years to open. We will return to this recurring plot twist shortly.
Put the three pillars together and you get the demand question that should open any steel analysis: is domestic construction accelerating or decelerating, is public money actually being disbursed, and are export doors opening or closing? Two of three pillars pointing up has historically been a decent environment; three of three marks the kind of boom that never lasts.
The Four Phases of a Steel Cycle — and What the Financials Look Like in Each
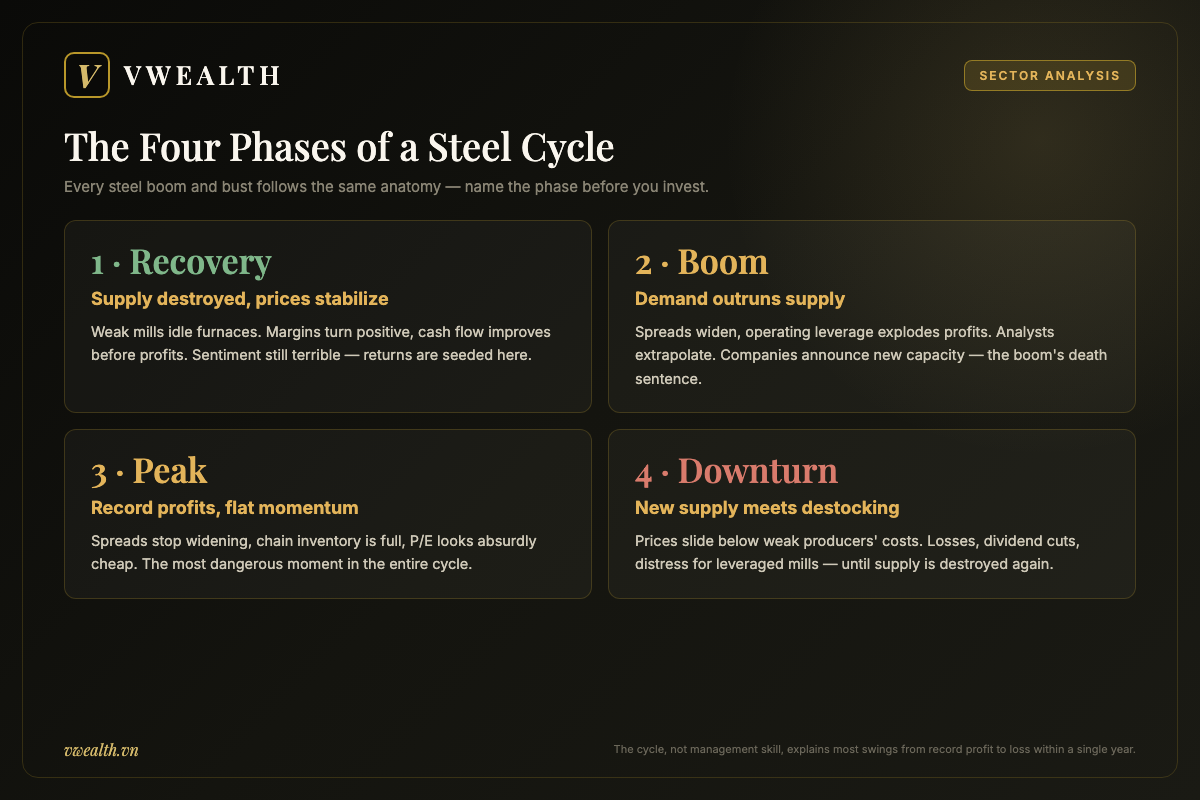
Commodity cycles feel chaotic in real time but follow a recognizable four-phase anatomy. Learning to name the phase you are in is half the job of a cyclical investor.
Phase 1: Recovery
The cycle bottoms when enough supply has been destroyed — weak mills idle furnaces, some exit entirely — and demand stops falling. Prices stabilize, then creep up. On financial statements you see gross margins turning from negative or near-zero to modestly positive, inventories shrinking, and cash flow improving before reported profit does. Sentiment is still terrible; the sector’s recent history is all losses. Historically, this unloved phase is where the largest returns are seeded, precisely because valuations still price in permanent misery.
Phase 2: Boom
Demand outruns supply. Prices rise faster than input costs, spreads widen, and operating leverage turns modest price gains into explosive profit growth. Every quarter beats the last. Analysts extrapolate, media discovers the sector, and steel stocks become market darlings. Companies announce capacity expansions — a detail that seems bullish and is actually the boom’s death sentence, as the next section explains.
Phase 3: Peak
Profits hit records, but the second derivative — the growth of growth — flattens. Spreads stop widening. Inventory across the supply chain is full because everyone over-ordered during the shortage. The stock may still rise on momentum, and the P/E ratio looks absurdly cheap. This is the most dangerous moment in the entire cycle, and it is engineered to fool people who screen for “cheap” stocks.
Phase 4: Downturn
New capacity arrives, demand cools, and buyers destock — they stop ordering and live off inventory, so mill shipments fall faster than end demand. Prices slide below the costs of weak producers. Profits collapse into losses, dividends get cut, and leveraged producers face genuine distress. The narrative flips to “structural oversupply” and “this industry is uninvestable” — which, with impeccable irony, is the sentiment that marks the approach of Phase 1 again.
Why a Low P/E Can Mark the Top of the Cycle
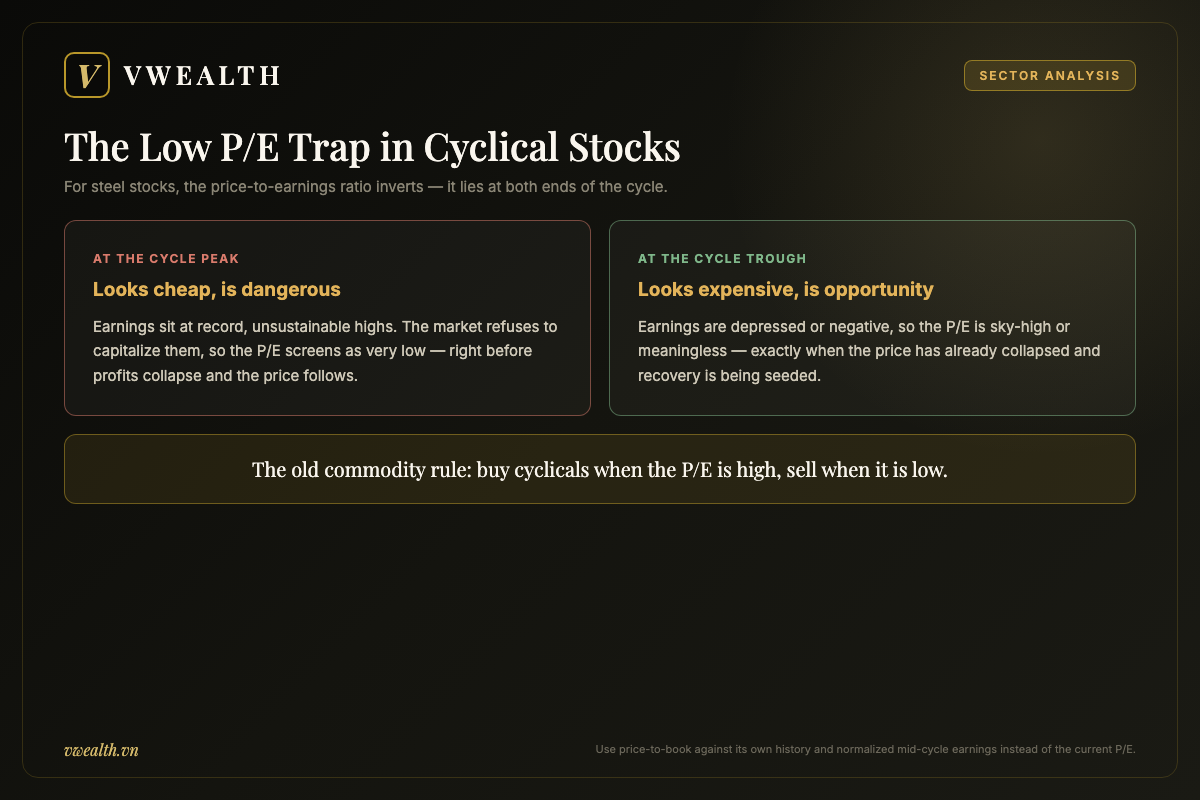
Here is the trap that has caught generations of investors, in Vietnam and everywhere else. The price-to-earnings ratio divides a company’s share price by its earnings per share, and most investors learn to read a low P/E as “cheap.” For stable businesses, that heuristic is fine. For cyclicals, it inverts.
Walk through the mechanics. At the peak of a boom, earnings (the E) are at record, unsustainable highs. The market knows those earnings will not last, so it refuses to pay a high multiple for them. Result: the share price sits at maybe five or six times peak earnings, and the stock screens as the cheapest thing on the exchange. Then the cycle turns, earnings fall 70 or 80 percent, and the “cheap” stock at 5x peak earnings turns out to have been trading at 25x its normal earnings all along. The price follows the earnings down.
Now the trough. Earnings are depressed or negative, so the P/E is sky-high or meaningless. The stock screens as expensive or unrateable — exactly when the price has already collapsed and the next recovery is being seeded. This is why old commodity hands repeat the counterintuitive rule: buy cyclicals when the P/E is high, sell them when it is low. The rule is a simplification, but the direction is right, and it is the opposite of what value screens teach.
Tools that lie less than the P/E
If the P/E misleads at both extremes, what should you use instead? Three tools, each with its own blind spot, work far better in combination:
| Valuation tool | How it works | Strength for cyclicals | Blind spot |
|---|---|---|---|
| Price-to-book (P/B) | Price divided by accounting net assets per share | Book value (plants, inventory, equity) is far more stable across the cycle than earnings; historical P/B ranges show when the market is pricing despair or euphoria | Book value can be impaired in deep busts; ignores differences in asset quality |
| Normalized earnings | Estimate mid-cycle profit — e.g., average margin over a full past cycle applied to current capacity — then apply a multiple | Cuts through peak and trough distortion; forces you to think about what “normal” looks like | Requires judgment; “normal” shifts when the industry structurally changes |
| Spread-based earnings model | Model profit directly from current steel prices minus input costs, times volume | Tracks the real profit engine in near-real time, ahead of quarterly reports | Tells you today’s run-rate, not where the cycle goes next |
A practical workflow: use the spread model to know what earnings are doing right now, normalized earnings to know what the company is worth through the cycle, and P/B against its own history to know whether the market’s mood is closer to panic or party. When all three agree, act with size. When they conflict — spread earnings booming but P/B at historical highs — you are probably late in Phase 2 or standing on the peak.
The Two Forces That End Every Boom: New Capacity and Trade Walls
Steel booms do not die of old age. They are killed by two forces the boom itself creates — and both are visible years in advance if you know where to look.
Capacity expansion: the cycle’s engine of self-destruction
When spreads are fat, every producer’s spreadsheet says the same thing: build more capacity. A new integrated steel complex, however, takes several years to permit, finance, and build. So capacity decisions made at the euphoric top come online during the subsequent downturn, adding supply exactly when demand no longer wants it — which deepens the bust, which idles capacity, which sets up the next shortage. This lag between investment decision and production start is the fundamental clock of every capital-intensive commodity cycle, from steel to shipping to semiconductors.
Vietnam has lived this pattern at scale. The country’s flagship integrated projects — multi-billion-dollar coastal complexes with their own deep-water ports — were each announced in confident times and each took years to ramp. The clearest live example is the leading producer’s second-phase complex at Dung Quat in central Vietnam: phased into operation through 2025 (its second basic-oxygen furnace was commissioned in August 2025), the project is designed to lift that single company’s crude-steel capacity by roughly three-quarters, toward about 16 million tonnes a year including around 9 million tonnes of hot-rolled coil. When a single project can add a double-digit percentage to national capacity, its startup date is a supply shock with a published schedule. That is a gift to investors: you can read announced projects, construction progress, and commissioning timelines from public disclosures long before the tons hit the market. A boom with a huge, well-known capacity wave arriving in eighteen months deserves a lower multiple than the same boom without one — yet the market repeatedly prices both alike.
Expansion has a second-order effect on the income statement. New plants arrive loaded with debt and depreciation. In good times, extra volume swamps those fixed charges. In bad times, financial leverage stacks on top of operating leverage: profit falls because spreads shrink, then falls again because interest and depreciation do not shrink with them. When you compare steel companies mid-cycle, the balance sheet — net debt against equity, and debt maturities against cash flow — determines who merely suffers in the bust and who is forced to sell assets or dilute shareholders at the bottom.
Tariffs and anti-dumping: the recurring plot twist
The second boom-killer — or sometimes boom-maker — is trade policy. Steel is among the most protected products on earth, because every government considers its mills strategic and its steel jobs political. Vietnamese investors meet this force from both directions.
Inbound, Vietnam has repeatedly used anti-dumping duties — extra import taxes imposed when foreign producers are found selling below fair value — and safeguard measures to shield domestic mills from floods of cheap imported steel, particularly when a supply glut in China pushes surplus tons across borders at desperation prices. A recent, concrete example: on 4 July 2025 Vietnam’s Ministry of Industry and Trade issued Decision 1959/QĐ-BCT imposing definitive five-year anti-dumping duties of roughly 23 to 28 percent on certain hot-rolled coil from China (effective 6 July 2025, following provisional duties set in February 2025), while terminating the parallel case against Indian-origin HRC. For domestic producers, such rulings act like a price floor: they widen the spread overnight without the company lifting a finger. Outbound, Vietnamese exporters face the same weapons in reverse: destination markets have imposed duties on various Vietnamese steel products over the years, sometimes on claims that Vietnamese mills merely re-process material originating elsewhere. In September 2025, for instance, the European Commission imposed definitive five-year anti-dumping duties of up to 12.1 percent on hot-rolled flat steel from Vietnam (alongside Japan and Egypt) — though the leading Vietnamese exporter was assigned a zero margin and effectively exempted, a reminder that these rulings hit companies unevenly. A ruling can close a market that absorbed a meaningful share of a company’s volume.
The investing lesson is not to predict specific rulings — you cannot — but to treat trade exposure as a permanent, recurring risk factor. Ask three questions of any steel stock: What share of revenue is exports, and to which markets? Does the company genuinely transform raw material domestically (which defends against origin-based accusations), or does it re-roll imported substrate? And has management historically diversified destinations after each trade shock, or does it keep concentrating on one lucrative door? Companies differ enormously on all three, and the differences rarely show up in a P/E screen.
Reading Where the Cycle Sits: A Practical Checklist
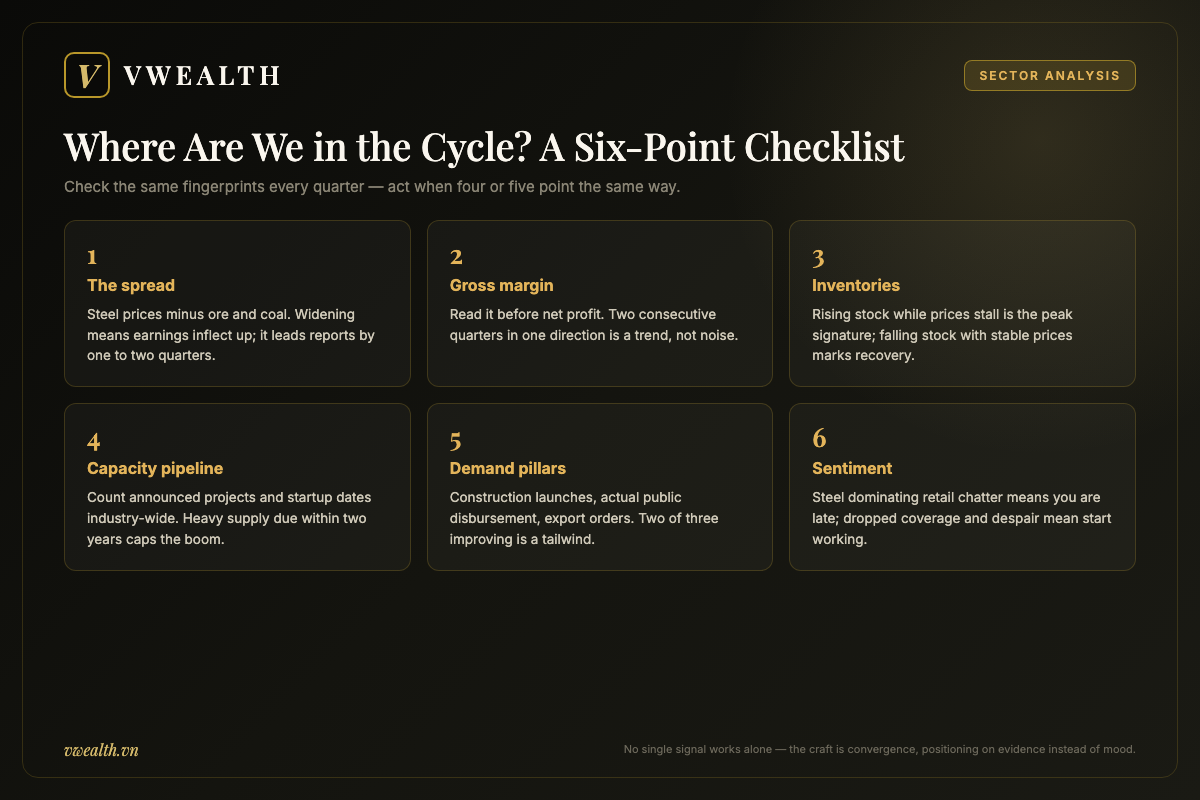
Nobody rings a bell at the top or the bottom. But the cycle leaves fingerprints, and a disciplined investor checks the same set of them every quarter rather than relying on mood. Here is a working checklist, ordered roughly from fastest-moving signal to slowest.
1. The spread itself. Track regional hot-rolled coil prices against iron ore and coking coal. You do not need a terminal; benchmark prices are widely published. A widening spread means earnings are inflecting up regardless of what last quarter’s report said; a narrowing spread means the opposite. This single series leads reported profits by one to two quarters.
2. Gross margin direction. In the reports themselves, ignore net profit first and read gross margin — revenue minus cost of goods sold, as a percentage. It is the cleanest window on the spread after inventory effects. Two consecutive quarters of expansion or contraction is a trend, not noise.
3. Inventory throughout the chain. Rising inventory at mills and traders while prices stall is the classic peak signature: everyone stocked up for a shortage that is ending. Falling inventories with stabilizing prices is the recovery signature. Company balance sheets report inventory every quarter; the ratio of inventory to quarterly revenue makes companies comparable.
4. Capacity announcements and utilization. Count announced projects and their scheduled startup dates, industry-wide, not just for your company. Heavy new supply due within two years caps how long a boom can run. Conversely, news of idled furnaces and cancelled projects is how bottoms are built.
5. The demand pillars. Construction permits and developer project launches (for private demand, with the lag discussed earlier), actual public investment disbursement (not budget announcements), and export order flow. Two pillars improving is a tailwind; all three deteriorating means Phase 4 has arrived whatever prices did this week.
6. Sentiment and positioning. When brokerage reports compete to raise steel targets and the sector dominates retail chatter, you are late. When analysts drop coverage and the consensus phrase is “structurally challenged,” start doing serious work. This is not contrarianism for its own sake — it reflects that in cyclicals, consensus opinion is usually a lagging description of the phase that is already ending. Vietnam’s market, still dominated by individual investors and in transition from frontier toward emerging-market status, swings especially hard on sentiment; the structural reasons are laid out in our analysis of Vietnam’s path from frontier to emerging market, and they make these crowd signals louder here than in developed markets.
None of these signals works alone. The craft is convergence: when four or five point the same way, the cycle is telling you its phase, and you can position against the crowd with evidence rather than bravado.
Beyond the Mills: Industrial Parks and the Wider Industrial Complex
“Industrial stocks” in Vietnam is a broader church than steel, and the adjacent pews are worth understanding — partly as alternatives, partly because they illuminate steel demand itself.
Industrial park developers: a different cycle wearing similar clothes
Industrial park companies lease serviced land and ready-built factories to manufacturers. Superficially they sound like steel’s cousins — heavy, industrial, construction-linked. Economically they are almost the opposite. Their demand driver is foreign direct investment: global manufacturers relocating or expanding production into Vietnam, a multi-decade structural flow driven by supply-chain diversification, labor costs, and trade agreements rather than by the quarterly steel spread. Their revenue model differs too: a landmark lease can be recognized as a large one-off gain, or spread over decades as recurring income, and the accounting choice dramatically changes how smooth reported profits look. When you analyze one, your first question is the size and location of the remaining leasable land bank — the inventory that future decades of revenue must come from — and your second is how much of current profit is recurring versus one-off lease recognition.
For a steel investor, industrial parks also serve as a demand indicator: every new factory is built with structural steel and roofed with galvanized sheet, and park occupancy trends hint at industrial construction volumes a year ahead.
Construction contractors, cement, and logistics
The rest of the complex rounds out the picture. Construction contractors turn steel and cement into buildings, but they operate on thin margins, fierce bidding, and receivables risk — when a developer client hits trouble, the contractor’s balance sheet catches the disease. Cement shares steel’s cyclicality and adds brutal energy costs and chronic domestic overcapacity. Industrial logistics — ports, warehousing — rides the same FDI wave as the parks with more recurring revenue. Each deserves its own analysis, but the shared lesson is the one this playbook keeps repeating: identify what actually drives each company’s profit — a spread, a land bank, a disbursement schedule — before you look at a single valuation multiple. If you want to see how professional analysts decompose these drivers company by company, the vwealth research library hosts full English-language reports on Vietnamese industrials that walk through exactly this logic with current numbers.
A Step-by-Step Framework for Analyzing a Vietnamese Steel Stock
Everything above condenses into a repeatable six-step routine. Run it in order; each step can disqualify a stock before you waste time on the next.
| Step | Question to answer | Where to look |
|---|---|---|
| 1. Business mix | What does the company actually sell (HRC, rebar, galvanized, pipe), via which route (BOF or EAF), and how much is exported to where? | Annual report segment notes; investor presentations |
| 2. Cost position | Is this a low-cost producer that survives troughs, or a marginal one that only earns in booms? Scale, self-owned ports, and energy deals decide this. | Gross margin versus peers across a full past cycle |
| 3. Balance sheet | Can it survive two bad years? Net debt to equity, debt maturity schedule, interest coverage at trough-level earnings. | Balance sheet and debt footnotes |
| 4. Cycle position | Which of the four phases are we in? Run the six-point checklist from the previous section. | Spreads, margins, inventories, capacity pipeline |
| 5. Valuation | P/B against the company’s own historical range, plus a normalized-earnings estimate. Explicitly distrust the current P/E. | Long price history; your own mid-cycle model |
| 6. Catalysts and risks | Scheduled capacity startups (its own and rivals’), pending trade cases, public investment programs, property-market inflections. | Company disclosures, trade ministry announcements, sector news |
Two habits make the framework work in practice. First, write down your cycle-phase judgment and the evidence for it before you look at the stock price, so the chart cannot seduce your reasoning. Second, size positions for the possibility that you are one phase early: cyclical investors who are right about direction still get hurt by entering at half the eventual drawdown. Position sizing and staged entries — the same discipline covered in our beginner’s roadmap to the Vietnamese market — matter more in this sector than almost anywhere else, because the swings are wider and the crowd louder.
Key Takeaways: Cyclicals Reward Timing and Punish Autopilot
Steel and industrial stocks are not better or worse than other sectors — they are different, and they punish investors who apply stable-business habits to cyclical machines. Keep five conclusions within reach:
Profit lives in the spread. A steel company is a machine that converts the gap between input costs and output prices into profit, with operating leverage that multiplies every move. Track the spread and you track earnings a quarter or two ahead of the reports.
The P/E inverts. Record-low P/E ratios cluster at cycle peaks because the market correctly refuses to capitalize unsustainable earnings; sky-high or negative P/Es cluster at bottoms. Use price-to-book against history and normalized mid-cycle earnings instead.
Booms carry their own executioners. Capacity announced at the top arrives in the bust, and trade rulings can redraw the map in either direction at any time. Both leave public, readable trails years in advance.
Demand stands on three legs. Private construction, public disbursement, and exports each run on separate clocks; count how many point up before deciding what phase you are in.
Adjacent is not identical. Industrial parks ride the multi-decade FDI flow, not the steel spread; contractors carry receivables risk; cement adds energy costs. Name each company’s true profit driver first.
None of this requires predicting prices — only recognizing patterns that have repeated through every steel cycle on record, and having the patience to act against the crowd when the evidence converges. This article is analysis for reference and education; it is not investment advice or a recommendation to buy or sell any security.
Research Vietnamese stocks in English with vwealth. Our AI-powered platform turns Vietnamese market data into full English analysis reports — with international payment support and a free 2-month trial for new accounts. Create your free account and read the latest reports.
Frequently Asked Questions
What are cyclical stocks?
Cyclical stocks are companies whose profits swing with the economic cycle rather than staying steady through it. Steel is the clearest example: at the top of the cycle these companies post record profits and trade at single-digit P/E ratios, looking like the cheapest names on the exchange — right before earnings collapse. At the bottom they bleed losses and look expensive, while quietly setting up the strongest returns of the next five years.
Why does the P/E ratio mislead you on cyclical stocks?
Because it lies at both ends of the cycle. A low P/E on a steel producer usually means earnings are at a peak that cannot last, so the denominator is about to fall and the stock is not cheap at all. A high P/E often appears at the bottom, when profits are depressed or negative — which is frequently the better entry point. Reading a cyclical company on P/E alone inverts the signal.
How do you identify a cyclical stock?
Look for a price-taker: a company that cannot set its own selling price. Steel is a commodity so standardized that a ton of hot-rolled coil from one mill is interchangeable with a ton from another, so buyers simply take the lowest price and every producer converges on a regional benchmark nobody controls. If a 20 percent fall in the regional price cuts the company’s revenue by roughly 20 percent regardless of product quality, it is cyclical.
How are cyclical stocks different from defensive stocks?
A defensive business has pricing power. A dairy producer with a trusted brand can raise prices a few percent a year and keep its customers; a software firm can charge for features rivals lack. A steel mill has no such lever — its revenue is hostage to a global commodity market shaped by Chinese supply, construction demand and freight rates. Pricing power is the dividing line.
What makes Vietnamese steel stocks especially volatile?
The same commodity rhythm, amplified by local conditions: a construction-heavy economy, a wave of capacity expansion, and trade politics where a single anti-dumping ruling can redraw the profit map. Vietnam has grown into the largest steel producer in Southeast Asia, with integrated mills making hot-rolled coil alongside a long tail of construction steel producers, so both ends of the cycle hit harder here.