Vietnam sold USD 475.04 billion of goods to the world in 2025 and bought USD 455.01 billion, taking two-way trade past USD 900 billion for the first time and leaving a surplus of USD 20.03 billion (National Statistics Office). Seven months into 2026 that surplus had become a USD 20.52 billion deficit, because imports grew 34.8% while exports grew 21.7% (National Statistics Office). Vietnam is, more than almost any economy of its size, a trade machine — and the machine is currently changing gear. This guide explains how the flows work, who the partners are, what the FTA network and the US tariff regime actually say, who owns the exports, and which listed Vietnamese companies are wired into those flows. It is educational reference material: a factual mapping of business models to trade data, with no recommendations and no price targets.
The size of the machine, in one page
Start with the scale, because the scale is the story. Vietnam’s total goods trade reached USD 930.05 billion in 2025, up 18.2% year on year, with exports of USD 475.04 billion (up 17%) and imports of USD 455.01 billion (up 19.4%), according to the National Statistics Office. Set that against a GDP of roughly USD 500 billion and you get a trade-to-GDP ratio that few countries have ever sustained. Vietnam does not have a large enough domestic market to absorb what its factories make. It never has. Everything downstream of that fact — the currency policy, the industrial policy, the diplomacy, the sensitivity to a single American executive order — follows from it.
Then look at the turn. In the first half of 2026, two-way trade hit USD 549.69 billion, up 27.1%, but the balance flipped: exports of USD 266.52 billion against imports of USD 283.17 billion, a deficit of USD 16.65 billion versus a USD 7.95 billion surplus in the same period of 2025 (Vietnam News Agency, citing the National Statistics Office). By the end of July the seven-month deficit had widened to USD 20.52 billion on exports of USD 319.53 billion and imports of USD 340.05 billion (Vietnam Investment Review). July alone produced a USD 3.59 billion gap.
Two numbers, two directions, twelve months apart. Working out what that means — and what it does not mean — is the most useful thing a foreign investor can do with Vietnam’s trade data right now. If you want the wider macro frame around these flows, our companion piece on the Vietnam economy in 2026 covers growth, inflation and policy; this article stays on the trade lens.
What Vietnam actually sells, and what it buys
The export mix is electronics first, everything else second
Vietnam’s export basket is far more concentrated than its reputation as a low-cost garment producer suggests. In 2025, electronics, computers and components alone earned USD 107.748 billion, up 48.4% year on year and an all-time record for the category (Vietnam News Agency). Eight product groups each cleared USD 10 billion and together accounted for 70.2% of total exports, led by electronics and followed by machinery and equipment, phones and components, and textiles and garments (Vietnam News Agency). Thirty-six categories cleared USD 1 billion, covering 94% of exports (VnEconomy).
Grouped differently, the National Statistics Office puts manufactured goods at USD 421.47 billion, or 88.7% of 2025 exports; agriculture and forestry at USD 39.46 billion (8.3%); seafood at USD 11.29 billion (2.4%); and fuels and minerals at USD 2.83 billion (0.6%). Read that split carefully, because it is the single most important corrective to the popular picture of Vietnam. This is an electronics and machinery exporter with a large agricultural sideline, not an agricultural country that also sews shirts. Rice, coffee, cashews and pepper generate headlines and genuine rural income, but nine dollars in ten of export earnings come from a factory.
That concentration cuts both ways. It means Vietnam’s export line is levered to the global electronics cycle — semiconductors, handsets, servers, and increasingly the equipment that goes into data centres. It also means a single large foreign manufacturer’s product cycle can move national statistics. Investors used to reading diversified export economies routinely underestimate how much of Vietnam’s monthly print is one industry.
The import bill is a production bill
Vietnam’s imports are not, in the main, things Vietnamese people consume. In the first seven months of 2026, capital goods — machinery, equipment, tools and raw materials — came to USD 319.95 billion, or 94.1% of the import bill, with consumer goods making up the remaining 5.9% (National Statistics Office). The 2025 figure was almost identical at 93.6%.
This is the key to interpreting the deficit. When Vietnam’s imports surge, it is usually because factories are buying inputs they intend to transform and re-export, not because households are buying imported cars. As Pham Anh Tuan put it in coverage of the seven-month numbers, production inputs account for more than 94% of the import bill (The Investor). The corollary is that an import surge today is often an export surge in three to six months, which is exactly the pattern several Vietnamese analysts expect for the second half of 2026.
There is a second, less comfortable driver. Energy costs pushed the bill higher: between January and July 2026, crude oil import volumes fell 11.9% while their value rose 18%, and refined fuel volumes rose 6% while their value jumped 67.6%. A production-input deficit is one thing; a price-driven fuel deficit is another, and the two are currently layered on top of each other.
The map of partners: two poles, one balance
Vietnam’s trade is not spread evenly. It is a pipeline running from China into Vietnamese factories and out again to the United States and Europe, and the bilateral balances make that geometry impossible to miss.
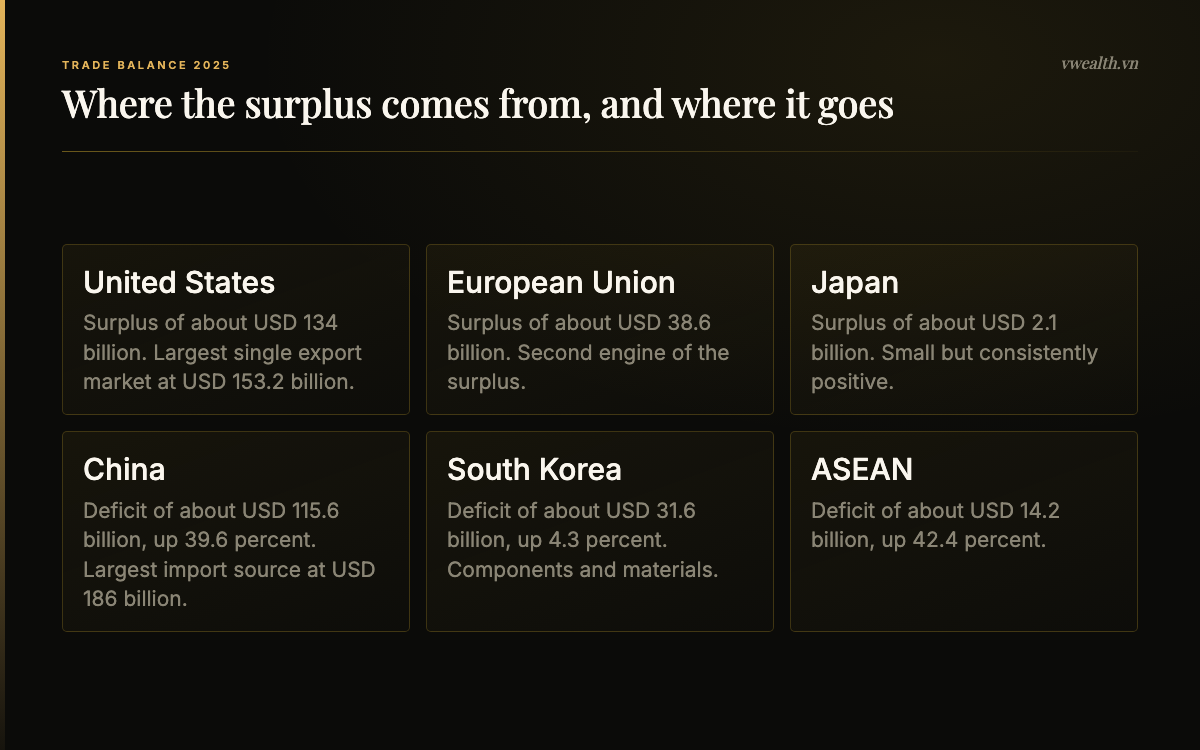
On the 2025 numbers reported by Viet Nam News from National Statistics Office data, Vietnam ran a surplus of about USD 134 billion with the United States, USD 38.6 billion with the European Union and USD 2.1 billion with Japan, against deficits of about USD 115.6 billion with China (up 39.6%), USD 31.6 billion with South Korea (up 4.3%) and USD 14.2 billion with ASEAN (up 42.4%). The United States took USD 153.2 billion of Vietnamese exports; China supplied USD 186 billion of Vietnam’s imports.
The pattern held into 2026 and intensified. In the first half of 2026 the United States remained the largest export market at USD 86.5 billion while China remained the largest import source at USD 115.2 billion (Vietnam News Agency); by the seven-month mark those figures had reached USD 104.7 billion and USD 138.6 billion respectively (National Statistics Office).
For an investor, three consequences follow. First, Vietnam’s national income is unusually sensitive to American demand and American trade policy, and to a lesser extent to European demand. Second, Vietnam’s cost base is unusually sensitive to Chinese supply — a disruption in Chinese components is a disruption in Vietnamese output within weeks. Third, the two exposures are not offsetting hedges; they are serial links in one chain. A shock at either end travels the whole length of it. That serial structure is also why the China Plus One relocation story and Vietnam’s trade politics are the same conversation viewed from different ends.
The 2026 swing: from record surplus to record deficit

The move from a USD 20.03 billion surplus in 2025 to a USD 20.52 billion deficit in seven months of 2026 is large enough to demand an explanation rather than a shrug. Coverage of the seven-month data noted that the deficit had already exceeded Vietnam’s previous full-year record of roughly USD 18 billion set in 2008.
Why several analysts are not treating it as a crisis
The argument for calm rests on composition. Can Van Luc of BIDV has framed the deficit as a sign of resilience rather than weakness, with companies importing more raw materials and components to secure supply amid global uncertainty and to prepare for stronger second-half production. Nguyen The Minh of An Binh Securities has made the cyclical point: early-year imports for production become later-year exports, and the balance repairs itself as those goods ship (The Investor).
The currency has so far agreed with them. Despite the size of the gap, the dong stayed broadly stable through the first seven months of 2026, supported by the foreign-invested sector’s own trade surplus of roughly USD 8 billion, remittances, tourism receipts and interest rate differentials. That said, a persistent goods deficit is exactly the kind of pressure that eventually shows up in the exchange rate, and currency is the tax that quietly reprices every foreign investor’s return in this market. Our guide to Vietnamese dong currency risk sets out how that works in practice.
The part that deserves more attention
Underneath the headline is a split that matters more than the headline. In the first seven months of 2026, foreign-invested enterprises exported USD 255.89 billion and imported USD 247.91 billion — a surplus of about USD 8 billion. Domestic Vietnamese firms exported USD 63.64 billion and imported USD 92.14 billion — a deficit of about USD 28.5 billion (Vietnam Investment Review).
In other words, the national deficit is a domestic-sector deficit. Foreign manufacturers are still net earners of foreign currency; Vietnamese companies are net spenders of it, buying machinery and inputs they do not yet make. That is a normal feature of an industrialising economy, and it is also the clearest statistical statement of how much of the value chain remains outside local hands.
Who actually owns the exports
This is the point at which trade analysis and equity analysis stop agreeing with each other. In 2025, the foreign-invested sector generated USD 367.09 billion of exports, or 77.3% of the total, while domestic firms generated USD 107.95 billion, or 22.7% — and domestic exports actually fell 6.1% while foreign-invested exports rose 26.1% (National Statistics Office). By the seven-month mark in 2026 the foreign share had risen to 80.1%.
Most of those foreign-invested exporters are unlisted. They are subsidiaries of Korean, Japanese, Taiwanese, Chinese and American groups, and their shares — where they trade at all — trade in Seoul, Taipei or New York, not on HOSE, HNX or UPCoM. You cannot buy Vietnam’s largest exporter on the Ho Chi Minh Stock Exchange.
So the honest framing for an equity investor is this: the Vietnamese stock market gives you indirect, partial and often second-order exposure to the export boom. You buy the infrastructure the exporters use, the services they consume, the domestic exporters that compete alongside them, and the banks that finance the working capital of the whole system. You do not buy the boom itself. Anyone selling you a “pure play on Vietnamese exports” is selling you a proxy, and the quality of that proxy is the entire question.
Our companion guide to Vietnam manufacturing and industrial stocks works through the factory-and-FDI side of that gap in detail, including industrial park landlords and materials suppliers. Rather than repeat it, this article stays on the trade channel: the goods, the routes, the rules and the companies paid for moving or making them.
The rulebook: FTAs and the tariff regime
The FTA network
Vietnam has built one of the densest free trade agreement networks in Asia, and the network is a real competitive asset rather than a diplomatic decoration. Three matter most for exporters.
The EU-Vietnam Free Trade Agreement entered into force on 1 August 2020. On the European Commission’s own account, EU-Vietnam goods trade runs at around EUR 76 billion a year, with an EU deficit of EUR 51.7 billion, making Vietnam the EU’s largest trading partner within ASEAN and its fourteenth largest overall; the EU’s main imports from Vietnam are machinery and appliances, which account for more than half the total, followed by footwear and textiles (European Commission). For Vietnamese producers of shoes, garments and processed food, EVFTA preference margins are the difference between a viable European order book and an unviable one — provided they can meet the rules of origin, which is a real operational hurdle for firms that buy fabric from China.
The Comprehensive and Progressive Agreement for Trans-Pacific Partnership gives Vietnam preferential access to Japan, Canada, Mexico, Australia and other Pacific economies, and it has become a genuine diversification channel: Vietnamese seafood exports to CPTPP markets reached USD 3.07 billion in 2025, up 22% year on year, according to the Vietnam Association of Seafood Exporters and Producers (VASEP, via VnEconomy). The Regional Comprehensive Economic Partnership, which links ASEAN with China, Japan, South Korea, Australia and New Zealand, matters less for tariff levels — many of those tariffs were already low — and more for cumulative rules of origin, which let a Vietnamese factory count inputs from other member countries towards local content thresholds. That single technical feature is one reason the China-to-Vietnam supply chain works as smoothly as it does.
The US tariff regime, 2025 to 2026
Nothing has moved Vietnamese export sentiment in the past two years like American tariff policy, and this is the section of the article most likely to be out of date first. Treat what follows as a description of the framework, not as today’s applied rate.
The sequence, as documented by Vietnam Briefing, ran as follows: a 46% reciprocal tariff on Vietnamese goods announced on 2 April 2025; a suspension on 9 April with a 10% baseline applied instead; a proposed arrangement on 2 July 2025 involving a 20% rate on Vietnamese goods and zero duties on US goods entering Vietnam; an executive order on 31 July 2025 setting the 20% rate; and effect from 7 August 2025. The same executive order provided for a 40% duty on goods found to have been transshipped to evade duties (Vietnam Briefing).
In October 2025 the two governments issued a joint statement on a framework for an agreement on reciprocal, fair and balanced trade. In it, the United States said it would maintain the 20% reciprocal tariff rate for imports from Vietnam while identifying additional products eligible for a zero rate, and Vietnam committed to preferential market access for substantially all US industrial and agricultural exports, along with a list of non-tariff commitments covering vehicle standards, medical devices, pharmaceutical approvals, intellectual property and digital trade (The White House; Office of the United States Trade Representative).
Two practical warnings. First, the legal basis for these tariffs has been contested in US courts and the applied rates have changed more than once; before you model a tariff number, verify the current rate for the specific tariff line with US Customs and Border Protection or USTR rather than trusting any article, this one included. Second, the transshipment rule is the sharpest edge for Vietnam specifically. It is aimed at goods routed through Vietnam to disguise a different origin, and enforcement turns on origin determination at the level of individual HS codes. A Vietnamese exporter that genuinely transforms imported inputs is in a different position from one that repackages them, and the market does not always price that distinction correctly in the days after a headline.
Non-tariff barriers that bite specific exporters
Tariffs get the headlines; standards decide many order books. Two current examples show how narrow and how expensive these can be. From 1 January 2026, exports from twelve Vietnamese fisheries face US import bans after the National Oceanic and Atmospheric Administration denied comparability findings under Marine Mammal Protection Act standards, affecting tuna, swordfish, grouper, mackerel, mullet, crab and squid among others. Separately, the European Union’s IUU “yellow card” on illegal, unreported and unregulated fishing remains an unresolved constraint on wild-caught exports (Vietnam Briefing). Neither is a tariff. Both change what a specific company can ship, to whom, tomorrow.
Mapping the trade engine onto listed companies
What follows is a factual mapping of business models to the trade flows described above. It identifies where a company’s revenue mechanically comes from, and nothing more. It is not a recommendation to buy or sell any security, it contains no price targets, and it makes no claim about whether any of these shares are cheap or expensive.
Ports, terminals and container shipping
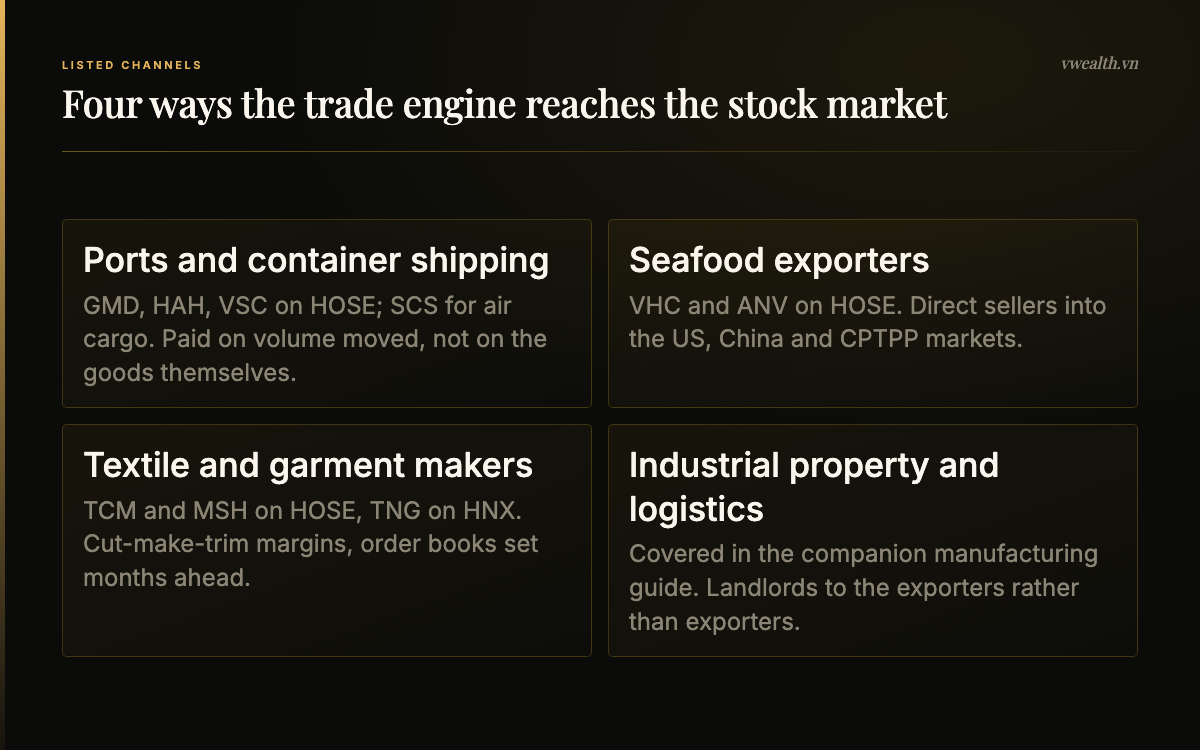
The purest link between trade volume and listed revenue is the box. Port operators and container shipping lines are paid for moving cargo, largely irrespective of what is inside it, which makes them a volume proxy rather than a bet on any one export category.
Gemadept Group (GMD, HOSE) is the clearest example: it describes itself as the only listed enterprise owning and operating a system of ports stretching from north to south Vietnam, spanning inland container depots, river ports, seaports and deep-water ports, alongside a logistics arm covering distribution centres, cold chain and heavy transport. Viconship (VSC, HOSE) operates in the Haiphong port cluster in the north. Hai An Transport and Stevedoring (HAH, HOSE) combines port operations with a container fleet of seventeen vessels of 800 to 3,500 TEU running domestic and intra-Asia routes, which means its earnings carry freight-rate sensitivity that a pure terminal operator does not. Saigon Cargo Service (SCS, HOSE) handles air cargo at Tan Son Nhat, giving it exposure to the high-value electronics that travel by air rather than sea.
The analytical points to hold onto: terminal operators are volume and tariff-per-TEU businesses with heavy fixed assets and long concession horizons; shipping operators add freight-rate cyclicality on top; air cargo handlers skew towards electronics and e-commerce rather than bulk. All of them care about total throughput, which means a deficit driven by rising imports is not automatically bad news for them — a full inbound box pays too. Our sector overview of Vietnam aviation and logistics stocks goes further into how these business models differ, and there is a dedicated company study of Gemadept if you want to see the framework applied to one name.
Seafood exporters
Seafood is the category where listed Vietnamese companies are genuinely the exporters rather than the suppliers to exporters. The sector earned USD 11.34 billion in 2025 on VASEP’s count, up 13% and above USD 11 billion for the first time, with shrimp at USD 4.65 billion (up 20%), pangasius at USD 2.19 billion (up 8%) and lobster at USD 817 million. By market, China and Hong Kong together took USD 2.45 billion (up 29%), the United States USD 1.9 billion (up 3%), the European Union USD 1.2 billion (up 12.5%) and CPTPP markets USD 3.07 billion (up 22%) (VASEP, via VnEconomy).
Two HOSE-listed pangasius specialists sit inside those numbers. Vinh Hoan Corporation (VHC, HOSE) farms and processes frozen pangasius, with frozen fillets alongside collagen and gelatin products and other value-added lines. Nam Viet Corporation (ANV, HOSE) runs an integrated model with fish farming and processing, and states full self-sufficiency in both aquaculture feed and raw fish for its plants.
What actually drives their results: raw fish and feed costs, average selling prices in the destination market, the mix between commodity fillets and value-added products, the US dollar exchange rate, and — the item most easily overlooked — administrative determinations. Anti-dumping duty reviews on Vietnamese seafood in the United States, the NOAA comparability findings noted above and the EU’s IUU status are all capable of changing a company’s addressable market without any change in demand.
Textiles and garments
Textiles and garments are one of the eight product groups that individually exceeded USD 10 billion in 2025, and the sector remains among the largest private-sector employers in the country. Three listed names give the clearest read on it.
Thanh Cong Textile Garment Investment Trading (TCM, HOSE) runs a vertically integrated chain from yarn through knitting and weaving to dyeing and sewing, exporting to more than forty markets including the United States, Japan, South Korea, China and the EU — integration matters because it makes rules-of-origin compliance under EVFTA and CPTPP easier to demonstrate. Song Hong Garment (MSH, HOSE) manufactures apparel and home textiles including bedding, with contract manufacturing for international brands. TNG Investment and Trading (TNG, HNX) is a Thai Nguyen-based export garment manufacturer operating eighteen branches with 367 sewing lines and shipping to more than fifty countries, and has diversified into real estate since 2019.
The economics here are less about the price of shirts and more about order visibility, capacity utilisation, labour cost inflation and the cut-make-trim margin. Garment makers typically confirm orders a season ahead, so their guidance is one of the earliest readable signals on Western retail demand. They are also the most tariff-exposed of the three channels in this article, because apparel usually sits outside exemption lists and competes directly with Bangladesh, India and Indonesia on landed cost.
What is deliberately not in this list
Industrial park developers and building-materials suppliers are genuine beneficiaries of the export economy, but they are landlords and input sellers rather than exporters, and they are covered in the manufacturing and industrial stocks guide. Banks are the largest indirect beneficiary of all, since trade finance and working capital for exporters flow through them, and the sector’s mechanics are set out in our guide to the Vietnamese banking system. And the largest exporters in the country, as discussed above, are simply not listed here.
What to monitor each month
Trade is one of the few areas where a foreign investor can build a genuinely current picture without paid data, because Vietnam publishes fast and in English. A workable monthly routine looks like this.
First, read the National Statistics Office monthly socio-economic report in the first week of each month. It gives you exports, imports, the balance, the domestic-versus-foreign split, the commodity groups above USD 1 billion and the headline partner numbers, all in one document. Second, watch the direction of the domestic-sector balance specifically, not just the national total; a narrowing domestic deficit tells you local firms are climbing the value chain, which is the structural change that would matter most over a decade. Third, track the export-to-import growth spread — exports up 21.7% against imports up 34.8% is a very different signal from both growing at the same pace, and the spread usually turns before the balance does.
Fourth, monitor the US applied tariff line for the categories you own, not the headline country rate; exemption lists operate at eight- to ten-digit HS code level, so two companies in the same sector can face different economics. Fifth, follow the non-tariff calendar: anti-dumping reviews, NOAA and FDA determinations, EU IUU status, and EVFTA rules-of-origin rulings. Sixth, keep an eye on the dong and on the balance of payments rather than the goods balance alone, since services, remittances and FDI inflows are what have been absorbing the 2026 goods deficit. Seventh, for port and shipping names, follow throughput at the Haiphong and Cai Mep-Thi Vai clusters and container freight rates, which move earnings faster than annual trade totals do.
Finally, remember what monthly trade data cannot tell you. It is a gross figure, not a value-added figure. A phone assembled in Bac Ninh from imported components counts its full export value in the national total even though only a slice of that value was created in Vietnam. This is why Vietnam’s trade-to-GDP ratio looks extraordinary and why headline export growth overstates how much the domestic economy actually captured.
How to use this without fooling yourself
Three habits separate people who use trade data well from people who use it to confirm what they already believed.
The first is to keep the framework and refresh the numbers. The permanent structure — an electronics-led export basket, a China-in and America-out geometry, a foreign-owned majority of exports, a dense FTA network, and a listed market that offers proxies rather than the assets themselves — changes slowly. The perishable items — this month’s balance, the current applied tariff, this quarter’s freight rates, the latest anti-dumping determination — change constantly and should be pulled fresh every time.
The second is to size the proxy honestly. If your thesis is “Vietnamese exports will grow”, ask what fraction of a given company’s revenue actually moves with export volumes, and over what lag. A terminal operator’s answer is close to all of it, with a short lag. A garment maker’s answer depends on the order book two quarters out. A bank’s answer is diffuse and delayed. The further the proxy, the more other factors will dominate your return.
The third is to respect the access constraints before the analysis. Foreign ownership limits, liquidity and settlement practicalities decide whether a good idea is even executable in this market; our explainers on foreign room and on how to invest in the Vietnam stock market as a foreigner cover the mechanics, and for investors who would rather hold the theme than the tickers, our comparison of Vietnam ETFs lays out the fund route.
Vietnam’s trade engine is the most legible part of its economy and the least directly investable. Both halves of that sentence are true at once, and holding them together is the whole discipline. The flows tell you where the country is going. The listed market tells you which small, specific set of businesses will be paid along the way.
This article is analytical reference material, not investment advice. It contains no recommendations and no price targets. Always do your own research and consider your personal risk tolerance before buying any security.
Research Vietnamese stocks in English with vwealth. Our AI-powered platform turns Vietnamese market data into full English analysis reports — with international payment support and a free 2-month trial for new accounts. Create your free account and read the latest reports.
Frequently Asked Questions
How big is Vietnam’s export economy?
Vietnam exported USD 475.04 billion of goods in 2025 against USD 455.01 billion of imports, for total two-way trade of USD 930.05 billion and a surplus of USD 20.03 billion, according to the National Statistics Office. That was the first year Vietnam’s trade turnover passed USD 900 billion, and it makes the country one of the most trade-intensive economies in the world relative to the size of its domestic market.
What does Vietnam export the most?
Electronics, computers and components, at USD 107.748 billion in 2025. Eight product groups each earned more than USD 10 billion and together made up 70.2% of exports, with machinery and equipment, phones and components, and textiles and garments ranking behind electronics. Manufactured goods as a whole accounted for 88.7% of 2025 exports; agriculture and forestry contributed USD 39.46 billion and seafood USD 11.29 billion.
Who are Vietnam’s biggest trading partners?
The United States is the largest export market, taking USD 153.2 billion of Vietnamese goods in 2025 and producing a bilateral surplus of roughly USD 134 billion. China is the largest source of imports at USD 186 billion, leaving Vietnam with a deficit of about USD 115.6 billion with China. Vietnam also runs surpluses with the EU and Japan, and deficits with South Korea and ASEAN.
Why did Vietnam swing to a trade deficit in 2026?
Imports grew far faster than exports. In the first seven months of 2026 exports rose 21.7% to USD 319.53 billion while imports rose 34.8% to USD 340.05 billion, producing a deficit of USD 20.52 billion. Around 94% of the import bill is production inputs such as machinery, equipment and raw materials, and higher fuel costs added to the gap, so analysts have read the deficit largely as front-loaded production buying rather than a consumption boom.
What tariffs does the United States apply to Vietnamese goods?
Under the framework announced in 2025 and confirmed in a joint statement in October 2025, the United States said it would maintain a 20% reciprocal tariff on imports from Vietnam, with a list of products eligible for a zero rate, while goods found to have been transshipped through Vietnam to disguise their origin face a 40% duty. Rates and their legal basis have moved repeatedly, so check the current applied rate with US Customs and Border Protection or USTR before relying on any figure.
Which Vietnamese listed companies are exposed to exports?
Exposure reaches the market through several channels: port and container shipping names such as GMD, HAH and VSC on HOSE and air-cargo handler SCS; seafood exporters VHC and ANV on HOSE; and textile and garment makers TCM and MSH on HOSE and TNG on HNX. This is a factual mapping of business models to trade flows, not a recommendation to buy or sell any of them.
How much of Vietnam’s exports come from foreign companies?
Most of them. Foreign-invested enterprises generated USD 367.09 billion, or 77.3% of exports, in 2025, and USD 255.89 billion, or 80.1% of the total, in the first seven months of 2026. Because most of those exporters are unlisted subsidiaries of overseas groups, a domestic investor cannot buy the export machine directly and has to reach it through suppliers, logistics and landlords instead.