Vietnam runs on trade. Goods flow out through its seaports, tourists and businesspeople flow in through its airports, and a growing web of trucks, warehouses and freighters connects the two. Vietnam logistics stocks — port operators, airlines, shipping and warehousing companies — are essentially a bet on that flow continuing to grow. But the three segments earn money in completely different ways, carry very different risk, and punish investors who treat them as one homogeneous “transport sector.” This guide explains how each business actually makes its profit, why high fixed costs make these stocks swing harder than the market in both directions, and which segment fits which kind of investor.
Why Trade Flows Decide Everything in This Sector
Start with one fact about the Vietnamese economy that shapes every company in this article: it is one of the most trade-intensive economies on the planet. The combined value of Vietnam’s exports and imports has, for years, run well above the size of its entire GDP. Very few countries of its size can say that. Electronics, textiles, furniture, footwear and seafood leave the country in containers; components, machinery and raw materials arrive the same way. When you buy a Vietnamese port stock, you are not really buying cranes and concrete — you are buying a claim on that container flow.
This matters because it defines what actually moves these stocks. A bank’s profit follows credit growth. A retailer’s profit follows household spending. A logistics company’s profit follows trade volume — how many containers cross the wharf, how many pallets move through the warehouse, how many passengers board the plane. Volume is the heartbeat. Everything else in this article — tariffs, load factors, fuel costs, operating leverage — is a layer on top of that heartbeat.
The good news for a long-term investor is that the structural direction of that heartbeat has a clear logic behind it. Vietnam has spent two decades positioning itself as a manufacturing base for global supply chains, helped by free-trade agreements, competitive labor costs and geographic position next to southern China. Factories need ports. A growing middle class flies more, both domestically and abroad. Rising e-commerce needs warehouses and last-mile delivery. None of this depends on any single quarter’s data — it is the multi-year backdrop.
The bad news is that trade flows are also cyclical and fragile in the short run. When Western consumers cut spending, orders at Vietnamese factories fall within months, and container volumes follow. When a pandemic closes borders, air passenger traffic can drop to nearly zero — as the whole world learned in 2020. So the same exposure that makes these stocks attractive over a decade makes them volatile over a year. Understanding that dual nature is the first requirement before buying anything in this space. If you are new to the market as a whole, it is worth reading our pillar guide on how to invest in Vietnam’s stock market as a foreigner first, because account setup, foreign ownership limits and trading mechanics all apply here too.
The Three Segments of Vietnam Logistics Stocks: A Map Before You Buy
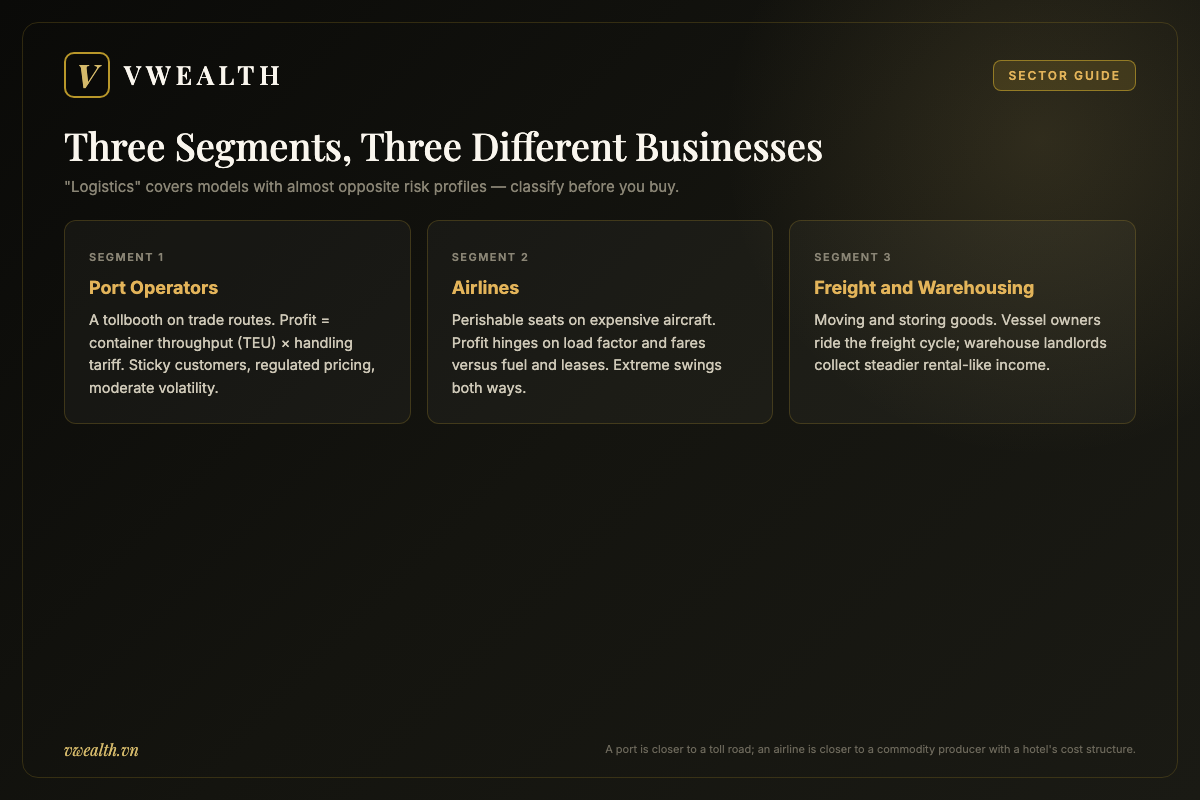
Investors often lump everything transport-related into one bucket. That is a mistake, because the three main segments have fundamentally different business models. A port is closer to a toll road. An airline is closer to a commodity producer with a hotel’s cost structure. A freight forwarder is closer to a trading company. Before looking at any individual stock, place it on this map.
| Segment | What the business really is | Main profit driver | Typical volatility |
|---|---|---|---|
| Port operators | A tollbooth on trade routes: ships pay to load and unload containers | Container throughput × handling tariff | Moderate — volumes swing, but pricing is relatively stable |
| Airlines | Selling perishable seats on expensive flying machines | Load factor and ticket yield versus fuel and leasing costs | Extreme — profits can flip to deep losses fast |
| Freight, shipping and warehousing | Moving and storing goods between factory, port and customer | Freight rates, utilization of trucks/vessels/warehouse space | Varies — asset-heavy shipping is very cyclical, warehousing steadier |
Notice what the table implies: the word “logistics” covers businesses with almost opposite risk profiles. A deep-water container terminal with long-term shipping-line customers can produce reasonably steady cash flow through a mild downturn. An airline can go from record profit to survival mode within two quarters. Any analysis that starts with “the logistics sector will benefit from trade growth” and stops there has told you nothing about which stock to own.
There is also a fourth, hybrid group worth knowing about: integrated logistics companies that own ports and shipping capacity and inland logistics. In Vietnam, Gemadept (ticker GMD) is the best-known listed example — it operates container terminals in both the north and the south and runs logistics services alongside them. Integration smooths some volatility, but it also means you must analyze each division separately rather than applying one multiple to the whole company. Meanwhile, the aviation side of the market includes the flag carrier Vietnam Airlines (HVN), the low-cost operator Vietjet (VJC), and — often overlooked — Airports Corporation of Vietnam (ACV), which operates most of the country’s airports and trades on the UPCOM board. An airport operator, like a seaport, is a tollbooth: it collects fees per passenger and per landing regardless of which airline is winning the fare war above it.
Port Operators: Tollbooths on Vietnam’s Trade Routes
How a container terminal actually earns money
A container port’s core revenue formula is beautifully simple: volume multiplied by price. Volume is measured in TEU — twenty-foot equivalent units, the standard container size, so one forty-foot box counts as two TEU. Price is the handling tariff: the fee a shipping line pays for each container lifted on or off a vessel, plus charges for storage, reefer (refrigerated container) plugs, and various services. When you read a Vietnamese port operator’s annual report, throughput in TEU is the single number to find first, because almost everything else scales from it.
Two features make this a better business than it first appears. First, the costs of running a terminal are mostly fixed — the berth, the cranes, the yard and much of the staffing cost roughly the same whether the port handles 80% or 60% of its capacity. That means each additional container is highly profitable once the port passes breakeven. Second, customers are sticky. A shipping line that has built a terminal into its Asia–Europe or trans-Pacific rotation does not casually switch, because schedules, customs procedures and inland connections are all wired around that call.
Two features cut the other way. Handling tariffs in Vietnam are not fully free-market: the state sets floor prices for container handling to stop destructive price wars between ports, and adjusts that framework over time. Circular 39/2023/TT-BGTVT, effective 15 February 2024, lifted the floor by roughly 10%, and a subsequent Ministry of Transport decision amending Decision 810/QD-BGTVT raises loaded-container handling charges at the deep-water hubs of Lach Huyen and Cai Mep–Thi Vai by about another 10% from 1 February 2026 — to a range of roughly US$63–73 per loaded 20-foot container (SGGP). So a port cannot simply raise prices whenever demand is strong — pricing power is real but regulated, and increases are staged administratively rather than left to the market. And capacity is lumpy: a new terminal opens all at once, dumping years’ worth of capacity onto a region overnight and pressuring utilization at every neighboring port until volume growth absorbs it.
Deep-water versus river ports: not all berths are equal
Vietnam’s port story has a geographic structure worth understanding. Historically, much of the country’s cargo could not sail directly to the US or Europe, because older river ports near Ho Chi Minh City and Haiphong could not receive the largest ocean-going vessels. Containers were first shipped on small feeder vessels to regional transshipment hubs such as Singapore or Hong Kong, then reloaded onto mother ships. Every transshipment adds cost and time.
That is why the deep-water complexes — Cai Mep–Thi Vai near Ho Chi Minh City and Lach Huyen near Haiphong — matter so much. Deep-water berths can receive the largest container ships afloat, enabling direct services to North America and Europe. These complexes are now scaling fast: Cai Mep–Thi Vai handled close to 6.3 million TEU of mother-vessel throughput in just the first ten months of 2025, up over 18% year on year, while Haiphong crossed the 2-million-TEU mark for the first time in 2025 as four new berths came on stream at Lach Huyen. By 2025, three Vietnamese ports ranked among the world’s 100 busiest container ports, a marker of how quickly the direct-call gateways have grown. For an investor, the practical question about any port stock is: where do its terminals sit in this hierarchy? A deep-water terminal on a growing direct-call route has a structurally better volume outlook than an upriver terminal competing on price for domestic and feeder cargo. It also faces different competition: deep-water terminals compete with other deep-water terminals and with regional hubs abroad, not merely with the port across the river.
What to track in a port operator
Beyond throughput growth, watch three things. Utilization: a terminal running near its designed capacity has pricing leverage and a case for expansion; one far below capacity will discount to fill berths. Expansion pipeline: new berths take years and heavy capital, so today’s construction announcements are tomorrow’s depreciation charges and, later, tomorrow’s growth — check how expansion is funded and whether debt is rising faster than cash flow. And customer concentration: a terminal dependent on one or two shipping alliances carries hidden risk, because alliances periodically reshuffle their route networks. None of these require insider knowledge; they are in the annual reports, and platforms that translate Vietnamese disclosures — including the English analysis reports on vwealth — can save you the trouble of decoding them from the original filings.
Airlines: The Most Leveraged Bet on Vietnamese Mobility
The revenue equation: seats, load factor and yield
An airline sells the most perishable product in business: a seat on a specific flight. The moment the aircraft door closes, every unsold seat becomes worthless forever. That single fact drives everything about airline economics, including why fare wars happen and why profits are so unstable.
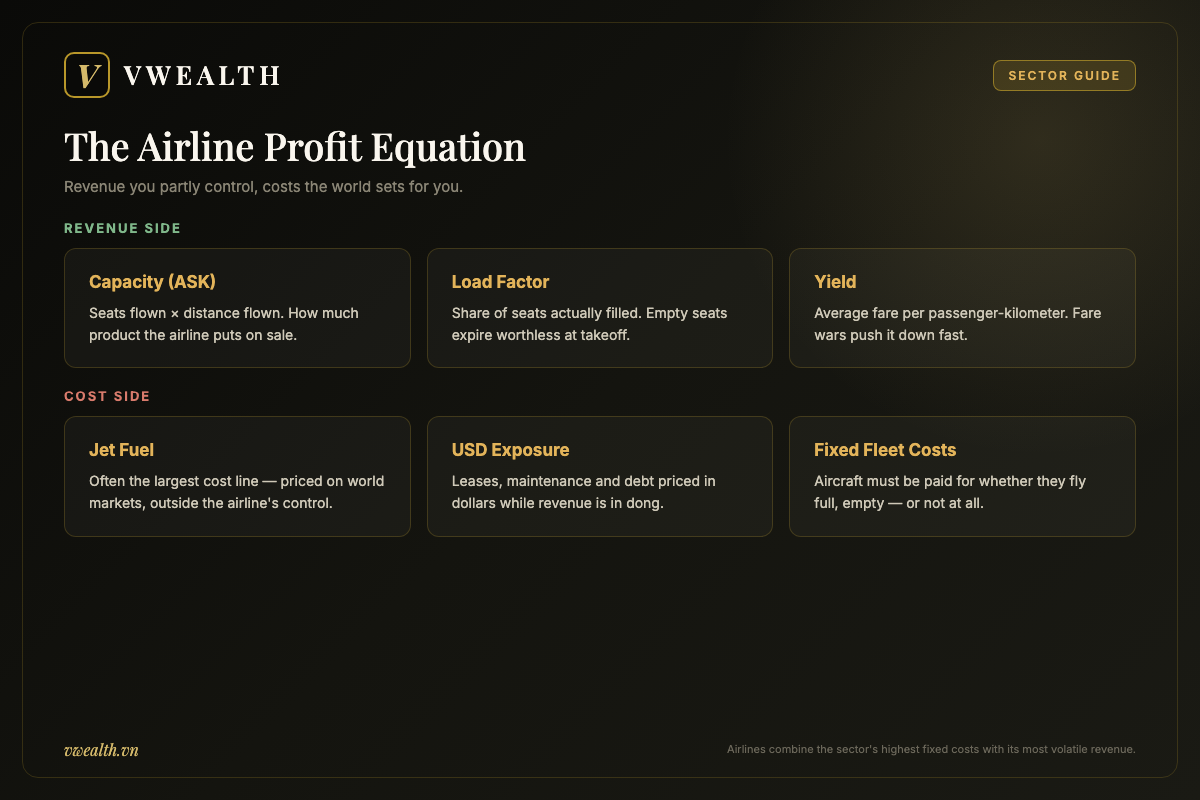
Three numbers define airline revenue. Capacity, measured in ASK (available seat kilometers — the number of seats flown multiplied by the distance flown), tells you how much product the airline put on sale. Load factor tells you what percentage of those seats were actually filled. Yield tells you the average fare earned per passenger-kilometer. Revenue is the product of the three. An airline can grow revenue by flying more (capacity), filling planes better (load factor) or charging more (yield) — but in a competitive market, pushing one usually pressures another. Add too much capacity and load factors or fares sag; hold capacity flat in a growing market and a rival takes the passengers.
Vietnam’s aviation market has a structural feature that shapes this competition: it is effectively a small oligopoly. The flag carrier and the dominant low-cost airline account for the bulk of domestic seats, with smaller players around the edges. Oligopolies can be rational (both players restrain capacity and earn decent margins) or irrational (both chase market share and destroy profits together). Which mode the market is in at any given time is one of the most important — and least forecastable — variables for airline shareholders.
The cost stack: fuel, dollars and metal
On the cost side, jet fuel is typically the largest single expense line for an airline, and its price is set on world markets — the airline controls consumption per seat (newer aircraft burn less) but not the price per liter. This connects aviation stocks directly to the energy complex: the same crude-oil moves that flow through Vietnam’s energy sector stocks hit airlines from the opposite direction. When oil rises, gas producers celebrate and airlines suffer; when it falls, the roles reverse. Some airlines hedge fuel with financial contracts; hedging smooths costs but can backfire spectacularly if prices fall after the airline has locked in higher levels, so always check the hedging policy in the notes to the financial statements rather than assuming it helps.
The second cost trap is currency. Vietnamese airlines earn most of their revenue in dong, but a large share of their costs — aircraft leases, maintenance, fuel, overflight fees — is priced in US dollars. Many aircraft are financed with dollar-denominated leases or debt. When the dong weakens against the dollar, those costs and liabilities inflate in dong terms, squeezing margins and sometimes producing large paper losses from revaluing dollar debt. This is exactly the mechanism described in our guide to Vietnamese dong currency risk for USD investors, but running in reverse: as a foreign investor you worry about the dong falling against your dollar, and the airline on your behalf worries about the same thing for its cost base. A dollar-based investor holding a Vietnamese airline is thus doubly exposed to the exchange rate — once through translation of returns, once through the company’s own cost structure.
Third is the metal itself. Aircraft are enormously expensive, and whether an airline owns or leases them, the cost of having them sits in the accounts as depreciation and lease expense that must be paid whether the plane flies full, flies empty or does not fly at all. Keep that thought — it is the heart of the operating-leverage section below.
Tourism and mobility as the structural driver
Why own an airline at all, given all this? Because the long-run volume story is genuinely strong. Air travel demand tends to grow faster than GDP in emerging economies: as incomes rise, flying shifts from luxury to routine. Vietnam adds three structural layers on top — a long, thin geography where flying beats driving for domestic trips, a major international tourism industry with room to develop further, and a diaspora plus business-travel base linked to its role in global manufacturing. The collapse and subsequent rebuilding of air travel around the pandemic years demonstrated both sides of the coin: traffic can vanish almost entirely in a crisis, and it can also rebuild toward its structural trend once borders reopen. The rebound is now on the record: in 2025 Vietnamese carriers flew a record 83.5 million passengers, up 10.7% on the year and the highest figure ever, while international arrivals to Vietnam hit a record of about 21.2 million — up more than 20% on 2024 and roughly 18% above the pre-pandemic 2019 peak, with more than 84% of those visitors arriving by air (VnExpress). The trend is the reason to invest; the volatility around it is the price of admission. Treat any single year’s traffic — boom or bust — as a data point, not a verdict.
Freight, Shipping and Warehousing: The Quiet Middle of the Chain
Between the port gate and the factory door sits everything else: container shipping lines, barge and trucking operators, freight forwarders, bonded warehouses, cold-chain storage and the modern logistics centers serving e-commerce. On Vietnam’s exchanges this is a long tail of small and mid-sized companies, and the segment splits into two very different economic species.
The first species is asset-heavy shipping — companies that own vessels and earn freight rates. This is one of the most brutally cyclical businesses in existence, worldwide. Freight rates are set by the global balance of ships versus cargo, and because ships take years to build and last decades, the industry perpetually overshoots: high rates trigger ordering booms that arrive just in time for the next downturn. The global container-freight spike of 2021–2022, when rates on some routes rose to several times their normal level and shipping companies everywhere posted extraordinary profits, was a textbook example — followed, as textbooks predict, by normalization as new capacity arrived. The lesson for stock pickers: a shipping company’s spectacular trailing earnings usually mark a cycle peak, not a new normal. A low price-to-earnings ratio built on peak freight rates is a trap, not a bargain. If you have read about the cyclical P/E illusion in steel stocks, this is the same illusion at sea.
The second species is asset-light or contract-based logistics — freight forwarding, distribution and warehousing. A freight forwarder does not own ships; it buys space from carriers and sells logistics solutions to shippers, earning a spread. Its profits are steadier but its moat is thinner, because competitors need little capital to enter. Warehousing sits in between: developers of modern logistics parks and bonded warehouses sign multi-year leases with manufacturers and e-commerce players, generating rental-like income that is far more stable than freight rates. The structural tailwind here is real: e-commerce growth and supply-chain diversification into Vietnam both create demand for modern warehouse space that the country historically lacked.
For an investor, the practical takeaway is to read the revenue mix before applying any label. Two companies both described as “logistics” may be a vessel owner riding freight rates and a warehouse landlord collecting rent — and they deserve opposite analytical treatment. The first question for any stock in this segment: how much of its profit comes from owning cyclical assets versus providing contracted services?
Operating Leverage: Why These Stocks Overshoot in Both Directions
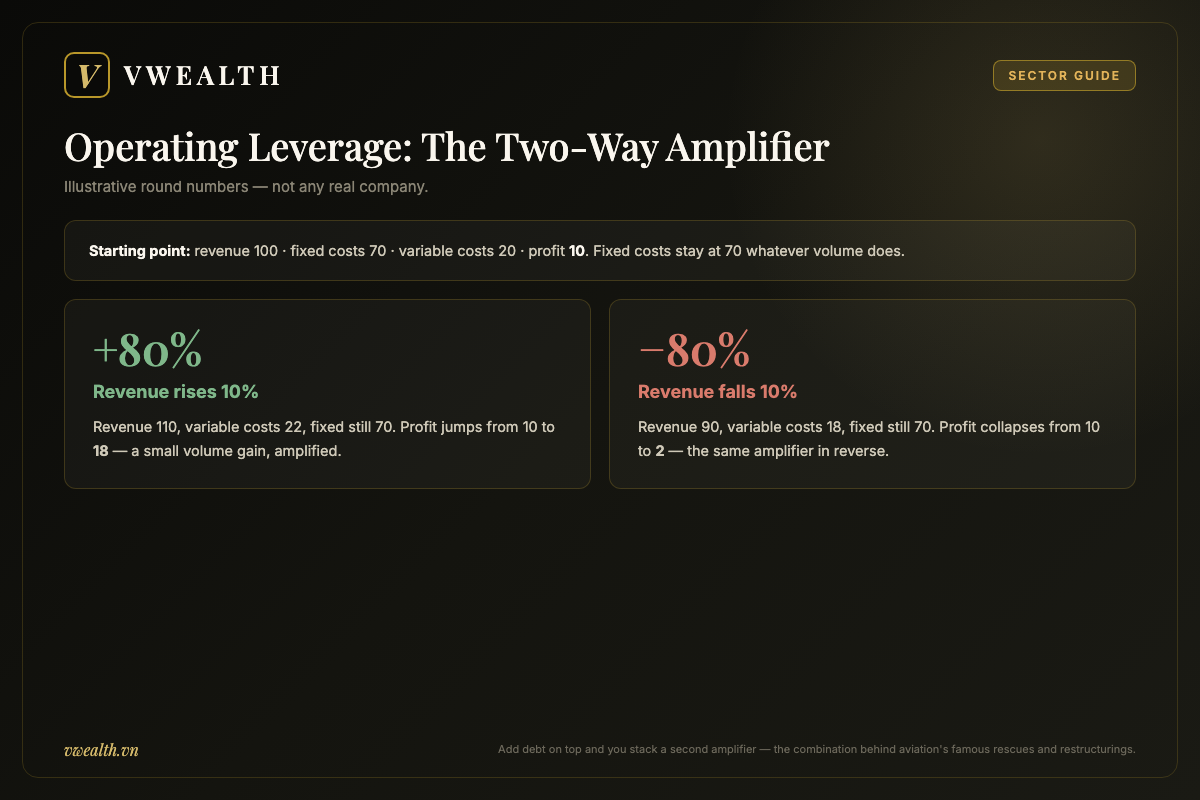
Now for the concept that ties the whole sector together and explains most of its stock-price behavior: operating leverage. Operating leverage means that a large share of a company’s costs are fixed — they do not fall when revenue falls or rise when revenue rises. Ports have berths and cranes. Airlines have aircraft leases and maintenance schedules. Shipping companies have vessels and crews. These costs march on regardless of volume.
The consequence is that profit changes are amplified versions of revenue changes. A worked illustration makes it concrete. Illustrative example — round numbers, not any real company: imagine a transport operator with revenue of 100, fixed costs of 70 and variable costs of 20, leaving a profit of 10. Now let volume rise 10%, so revenue goes to 110 and variable costs to 22, while fixed costs stay at 70. Profit becomes 18 — an 80% jump from a 10% revenue increase. Run it in reverse: revenue falls 10% to 90, variable costs to 18, and profit collapses to 2 — down 80%. The same machine that multiplies gains multiplies losses. Push revenue down another 10% and the company is loss-making.
This arithmetic explains several things you will observe in practice. It explains why airline profits are so violent: airlines combine the sector’s highest fixed costs with its most volatile revenue. It explains why port stocks can deliver strong earnings growth in a trade upswing even when tariffs barely move — the extra containers fall almost straight to the bottom line. It explains why the market prices these stocks with such wide swings: investors are not just forecasting revenue, they are forecasting revenue put through an amplifier. And it explains why debt matters doubly here. Financial leverage (borrowing) stacks a second amplifier on top of the operational one. A heavily indebted airline or shipping company in a downturn faces amplified operating losses and fixed interest bills at the same time — the combination that produces the restructurings and rescue packages this industry is famous for globally. Vietnam’s own market provided a vivid case study in the pandemic era. By the end of 2022 Vietnam Airlines (HVN) had piled up accumulated losses of about VND34 trillion and negative equity of roughly VND10 trillion, drawing repeated delisting warnings from the Ho Chi Minh Stock Exchange and requiring state-backed support to stay afloat. Then the amplifier ran the other way: as international traffic rebuilt and fuel prices eased, the carrier swung to a consolidated pre-tax profit of about VND7.7 trillion in 2024 and posted record consolidated revenue above VND123 trillion in 2025. The airline survived and recovered; shareholders learned an expensive lesson about what two stacked amplifiers do in reverse gear — and how sharply they can snap back.
The investing implication is not “avoid the sector.” It is: know where you are in the volume cycle before you rely on trailing earnings, prefer balance sheets that can absorb a bad year, and expect drawdowns in these names to be deeper than the index during recessions — and recoveries to be sharper. Position size accordingly.
How to Value Aviation and Logistics Stocks: Different Segments, Different Yardsticks
Because the three segments have different economics, they need different valuation tools. Applying a single P/E screen across the sector will systematically mislead you — it will make cyclical shipping companies look cheapest at their most dangerous moment and make steady port operators look expensive at their safest.
| Segment | Primary yardsticks | Why | Classic mistake |
|---|---|---|---|
| Ports and airports | EV/EBITDA; P/E on normalized earnings; dividend record | Stable, infrastructure-like cash flows; heavy depreciation understates cash generation | Ignoring an upcoming capacity expansion that will lift depreciation and debt for years |
| Airlines | EV/EBITDAR historically used to compare across owned vs leased fleets; cycle-average earnings; balance-sheet strength first | Reported net profit is hostage to fuel, currency and one-off items; leverage decides survival | Buying on a low P/E at the top of a travel boom |
| Shipping (asset owners) | P/B versus fleet value; position in the freight-rate cycle | Earnings swing too wildly for P/E to mean anything; vessels have observable market values | Extrapolating peak freight rates into a permanent earnings level |
| Forwarding and warehousing | P/E on contracted earnings; growth in leased/occupied capacity | Service income is steadier; growth pipeline is the story | Paying a high multiple for a forwarder with no moat against competition |
A few of these terms deserve one-line explanations. EV/EBITDA compares enterprise value (market value of shares plus net debt) with earnings before interest, taxes, depreciation and amortization — useful when depreciation policies differ or distort profit. EV/EBITDAR adds rent and lease costs back as well, which analysts historically used to compare airlines that lease aircraft against airlines that own them, though changes in lease accounting standards have narrowed the difference. P/B compares price with book value — the accounting value of net assets — and works best where assets have observable market prices, like ships. “Normalized” or “cycle-average” earnings means averaging profit across several years, good and bad, to strip out where you happen to sit in the cycle.
One more valuation habit specific to this sector: separate the tollbooths from the vehicles. Within one conglomerate or one portfolio, infrastructure assets (terminals, airports, warehouses) merit higher, steadier multiples, while operators (airlines, vessel owners) merit lower, cycle-adjusted ones. When a listed company contains both, value the parts separately and sum them, rather than letting the stable half disguise the cyclical half. And whichever yardstick you use, resist quoting today’s ratios from memory or from stale screens — pull the current numbers from the company’s latest filings, or open an updated analysis platform, before anchoring on a figure.
The Risk Map: What Can Go Wrong in Each Segment
Every thesis in this sector should be paired with its specific failure modes. Here is the honest list, segment by segment.
Ports: competition arrives in concrete
The main risk to a port is another port. Because capacity arrives in huge indivisible chunks, a new deep-water terminal in the same region can depress utilization and pricing for every incumbent for years. Watch national port master plans and announced projects, not just the company you own. Secondary risks: shifts in shipping-alliance networks that reroute vessel calls; trade-policy shocks that redirect manufacturing; and regulatory changes to the tariff floor framework. Ports are the safest segment here, but “safe” means slower-moving risks, not absent ones.
Airlines: everything, all at once
Airlines carry the longest risk list in the entire stock market: fuel spikes, currency depreciation, fare wars, pandemics, recessions, accidents, groundings of specific aircraft types, airport capacity constraints, and regulatory caps on fares or routes. No airline controls more than a fraction of these. Two additional Vietnam-specific notes. First, aviation carries its own foreign-ownership cap under transport regulation, separate from the general market rules. As of mid-2026 that cap is 34% of an airline’s charter capital under Decree 92/2016/ND-CP (as amended by Decree 89/2019/ND-CP) — lower than the general market’s foreign limits — with a draft decree under public consultation proposing to raise it toward 49% (Vietnam News); check the current limit and remaining room before assuming you can buy. Second, airport infrastructure is a state-directed domain, so an airline’s growth can be gated by how fast new terminals and the country’s major new airport capacity come online — a variable entirely outside its control. None of this makes airlines uninvestable; it makes them a segment where the balance sheet is the first page to read, and where position sizes should reflect the real possibility of multi-year loss stretches.
Freight and warehousing: cycles and competition
For vessel owners, the risk is the freight cycle itself — a global force no Vietnamese company influences. For forwarders, it is competition and margin compression, since barriers to entry are low. For warehouse developers, it is overbuilding: the same lumpiness problem ports have, in a market where many industrial developers can add supply. Across all three, watch counterparty concentration — a logistics company earning most of its revenue from one manufacturer or one e-commerce platform inherits that customer’s fortunes.
Sector-wide: the macro trio
Three macro variables cut across every segment: global trade demand (Western consumer spending, in practice), oil prices, and the dong–dollar exchange rate. You cannot diversify these away inside the sector, because they hit ports, airlines and shipping simultaneously. If your broader portfolio already leans heavily on Vietnamese exporters, recognize that adding logistics stocks concentrates the same bet rather than diversifying it. The broader market context is covered in our comprehensive guide to the Vietnamese stock market for foreign investors, and it is worth mapping where a logistics position sits inside your overall Vietnam exposure before adding it.
Which Segment Suits Which Investor
Pulling the threads together, here is the honest matching exercise between the three segments and three investor temperaments.
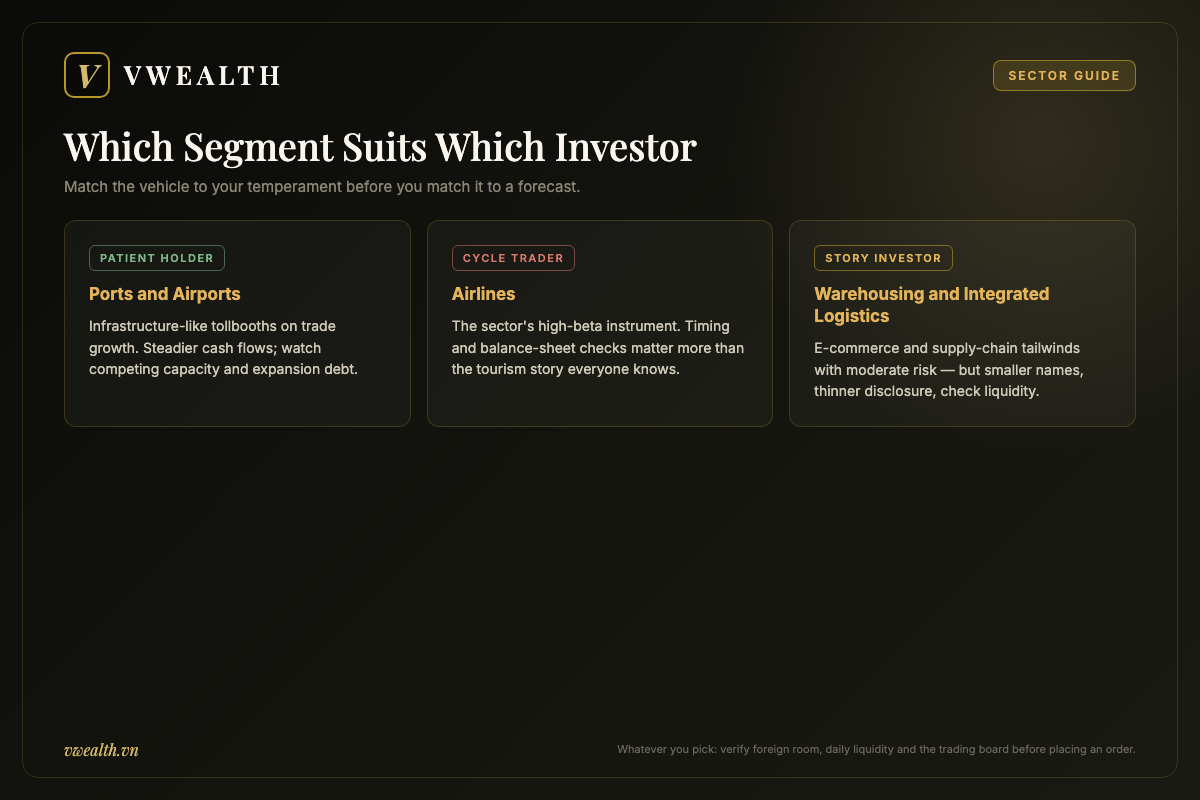
If you want infrastructure-like exposure to Vietnam’s trade growth with the least drama, look at the tollbooths: ports and the airport operator. Their volumes track the structural story, their pricing is regulated but stable, and their fixed-cost leverage works quietly in their favor during expansions. The trade-offs: growth is bounded by physical capacity, expansion phases suppress reported profits for years, and you must monitor competing capacity in the same region. This is the segment for the investor who reads annual reports twice a year and wants to hold through cycles.
If you can stomach violent swings for potentially violent rewards, airlines are the sector’s high-beta instrument. Bought at the depths of a travel downturn, with a survivable balance sheet, an airline can multiply as traffic and fares recover; bought at the top of a boom, the same stock can lose most of its value. Success here is mostly about timing the cycle and verifying solvency, not about the long-run tourism story everyone already knows. This is the segment for an experienced investor treating it as an explicit cyclical trade, sized so that a worst-case outcome is tolerable.
If you want the structural e-commerce and supply-chain story with moderate risk, the contract-based middle — warehousing and integrated logistics — is the compromise. Steadier than shipping, faster-growing than mature ports, but demanding more work: the listed companies are smaller, disclosure is thinner, and you must check liquidity before building any meaningful position, since some of these names trade modest daily volumes. Asset-heavy shipping, meanwhile, belongs only in the hands of investors who explicitly understand commodity cycles and are willing to sell into euphoria — the opposite of what feels natural.
A final placement note for foreign investors: whatever segment you choose, verify three practical things before ordering — the stock’s foreign-ownership room, its average daily trading value, and which board it trades on, since some names in this sector sit on UPCOM rather than HOSE, with different liquidity and disclosure standards. The mechanics are covered step by step in the foreigner’s guide to investing in Vietnamese stocks.
A Practical Research Checklist Before You Buy
Here is a compact routine for analyzing any Vietnam aviation or logistics stock, designed to take one focused evening rather than a week.
Step 1 — Classify the business. Tollbooth, operator, or service provider? Split the revenue mix by division if the company is integrated. This decides which yardsticks apply.
Step 2 — Find the volume metric and its trend. TEU throughput for ports; ASK, load factor and passenger numbers for airlines; tonnage, utilization or leased area for the rest. Compare several years, not one, and note where the metric sits relative to designed capacity.
Step 3 — Measure the amplifiers. Estimate the fixed-cost share from the income statement’s stability across good and bad years, then read the balance sheet: net debt versus operating cash flow, currency composition of debt, lease obligations in the notes. High operating leverage plus high financial leverage demands a discount, not a premium.
Step 4 — Locate the cycle. Are trailing earnings from a boom year or a trough year? Value the stock on normalized earnings or assets, and be most suspicious precisely when the trailing P/E looks most flattering.
Step 5 — List the two or three external variables that dominate the story — a competing terminal opening, the fuel price, a fleet-expansion plan — and decide how you will monitor them. If you cannot name what would break the thesis, you do not yet have a thesis.
Step 6 — Check the practicalities: foreign room, liquidity, board, and whether English-language information is available regularly enough for you to stay informed after buying — the point where an English-language research platform earns its keep.
The Bottom Line: Buying the Flow, Not the Forecast
Vietnam logistics stocks offer one of the cleanest ways to own the country’s trade-driven growth model — but only if you respect the sector’s structure. Ports and airports are regulated tollbooths that compound quietly with container and passenger volumes. Airlines are magnificent, fragile machines where operating and financial leverage stack into the market’s most extreme risk-reward profile. Shipping rides a global commodity cycle; warehousing rents out the supply-chain boom. One label, four different games. The investors who do well here are the ones who classify first, check the balance sheet second, locate the cycle third — and only then look at the price. The structural flow of goods and people through Vietnam is the reason to be here; discipline about which vehicle you ride, and at what point in the cycle, decides whether that flow reaches your portfolio.
This article is educational analysis for reference only and is not investment advice or a recommendation to buy or sell any security.
Research Vietnamese stocks in English with vwealth. Our AI-powered platform turns Vietnamese market data into full English analysis reports — with international payment support and a free 2-month trial for new accounts. Create your free account and read the latest reports.
Frequently Asked Questions
What are Vietnam logistics stocks?
Port operators, airlines, shipping and warehousing companies — essentially a bet on Vietnam’s trade flows continuing to grow. Goods flow out through its seaports, tourists and businesspeople flow in through its airports, and a growing web of trucks, warehouses and freighters connects the two.
Why do trade flows decide everything in this sector?
Because Vietnam is one of the most trade-intensive economies on the planet. The combined value of its exports and imports has for years run well above the size of its entire GDP — very few countries of its size come close. Every company in the sector sits downstream of that flow.
Are ports, airlines and shipping the same investment?
No, and treating them as one homogeneous transport sector is how investors get hurt. The three segments earn money in completely different ways and carry very different risk, so the right question is which segment fits which kind of investor rather than whether the sector as a whole is cheap.
Why are logistics stocks more volatile than the market?
High fixed costs. When a business carries heavy fixed costs, a small change in volume swings profit far more than proportionally — which makes these stocks move harder than the market in both directions, up and down alike.
Which logistics segment suits a conservative investor?
That depends on how each segment’s economics line up with your tolerance for swings. The practical approach is to understand how each business actually makes its profit first, then match that profile against your own risk appetite — not to buy the sector wholesale.