Somewhere in Vietnam right now, a family that has bought rice, shampoo and cough medicine from the same street vendors for thirty years is walking into an air-conditioned chain store for the first time — and they will probably never fully go back. That single change of habit, multiplied across a hundred million people, is the entire investment case for Vietnam retail stocks. The country still does most of its shopping through traditional channels, which means the shift to organized chains has years of runway left. But owning that shift is harder than it sounds: retail is a brutally thin-margin business where a two-percentage-point mistake wipes out the profit, where the best companies deliberately report ugly earnings while they expand, and where e-commerce is rewriting the rules mid-game. This guide explains how chain retailers actually make money, which numbers separate winners from casualties, how the four main battlegrounds — electronics, grocery, pharmacy and jewelry — differ, and how to read a retailer’s quarterly report without being fooled by the expansion J-curve.
The Decade Story: Why Shopping in Vietnam Is Migrating from Street Markets to Chains
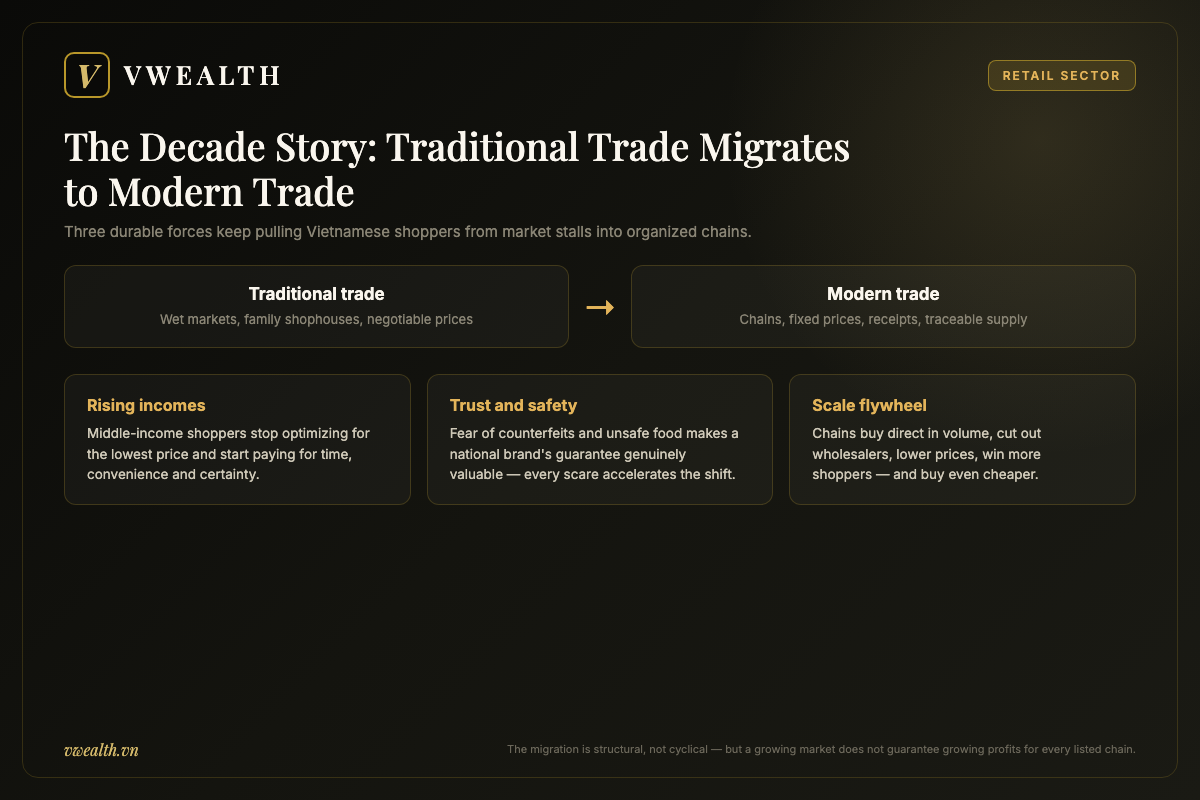
Every retail market on earth has gone through the same transition. Shopping starts in traditional trade — wet markets, family-run shophouses, independent mom-and-pop stores — and gradually migrates to modern trade: organized chains with standardized stores, centralized purchasing, barcoded inventory and consistent pricing. The United States made this journey decades ago. Thailand and Malaysia are far along it. China compressed it into twenty years. Vietnam is still in the middle of it, and that is precisely why the sector attracts so much investor attention.
The terms are worth pinning down because analysts use them constantly. Traditional trade means unorganized retail: the market stall, the corner shop where the owner knows your name and prices are negotiable. Modern trade means organized retail: supermarkets, convenience stores, chain pharmacies, branded electronics stores — any format where a company operates many identical outlets from a central system. The share of total retail spending that flows through modern trade is called modern trade penetration, and in Vietnam that share remains low compared with regional neighbors, particularly in groceries and medicine, where the overwhelming majority of transactions still happen in traditional channels. To put a rough figure on it: modern retail channels (chains, malls, convenience stores and e-commerce combined) accounted for only around 30% of total retail sales by the mid-2020s, and in the grocery category specifically, wet markets and independent shops still handled the clear majority of sales — local reporting put traditional wet markets at roughly two-thirds of grocery sales as of the mid-2020s. That gap between low current penetration and the near-total penetration seen in richer neighbors is, quite literally, the runway the whole sector is running down.
Why does the migration happen at all? Not because chains are fashionable, but because they win on economics and trust once a country reaches a certain income level. Three forces drive it, and each one is durable rather than cyclical.
Income growth changes what shoppers optimize for
A low-income shopper optimizes for the absolute lowest price and will happily spend time haggling across three market stalls to save a few thousand dong. A middle-income shopper starts optimizing for time, convenience and certainty — fixed prices, receipts, air conditioning, the ability to return a faulty product. Vietnam’s per-capita income has been compounding for three decades, and every year of that growth pushes another cohort of households across the line where the chain store’s value proposition beats the market stall’s. This is the same underlying force behind the broader Vietnamese consumer sector story, but retail is where it shows up in its most concentrated, most measurable form: you can literally count the stores.
Trust and safety concerns favor organized players
Counterfeit goods, unsafe food and fake medicine are persistent worries for Vietnamese consumers. A chain with a national brand has something the street vendor does not: a reputation worth billions that it cannot afford to burn on one bad batch. When a food-safety scare hits the news, foot traffic shifts toward supermarkets with traceable supply chains. When shoppers worry about counterfeit electronics or fake pharmaceuticals, they pay a small premium for the chain’s guarantee. Each scare accelerates the migration a little, and the migration does not reverse when the scare fades.
Suppliers and landlords prefer chains
The third force is invisible to shoppers but decisive for economics. A chain with hundreds of stores buys directly from manufacturers in enormous volumes, skipping layers of wholesalers that each took a cut in the traditional system. That purchasing power translates into lower costs, which the chain can split between fatter margins and lower shelf prices — using the price advantage to pull even more shoppers away from traditional trade, which increases volume, which increases purchasing power again. This flywheel is the core reason modern trade, once it reaches critical mass in a category, tends to keep winning. Landlords reinforce it: a national chain is a more reliable tenant than an independent shopkeeper, so chains increasingly get the best locations.
For an investor, the practical takeaway is this: the traditional-to-modern migration is a decade-scale structural trend, not a quarterly trade. It gives well-run Vietnamese retail chains a growth tailwind that does not depend on GDP acceleration or government stimulus. But — and this is the trap that catches new investors — a growing market does not automatically mean growing profits for every listed retailer. Retail is a business where execution is everything, because the margins are razor thin. To see why, you need to open up the machine.
How a Retail Chain Actually Makes Money: The Anatomy of Thin Margins
The first shock for investors coming from other sectors is how little of each sale a retailer keeps. A software company might keep twenty or thirty percent of revenue as net profit. A good bank keeps a similar share. A retail chain that keeps four percent of revenue as net profit is doing well; many operate at one to three percent. Understanding why — and why that thinness is a feature of the model, not a flaw — is the foundation for everything else in this article.
From gross margin to net margin: where the money leaks out
Start with gross margin: the difference between what the retailer sells a product for and what it paid the supplier, expressed as a percentage of revenue. Gross margin varies enormously by category. Fresh groceries might carry gross margins in the teens or low twenties. Consumer electronics are similar — phones and laptops are commoditized, and shoppers compare prices ruthlessly. Pharmacy sits higher, and jewelry higher still on fabricated items, because the craftsmanship and brand are part of what you are buying.
But gross margin is only the starting line. From it, the retailer must pay rent for every store, salaries for every salesperson and cashier, electricity for all that air conditioning, logistics to move goods from warehouses to shelves, marketing, headquarters overhead, interest on debt, and tax. What survives is net margin — and in retail, the gap between gross and net is where the entire game is played.
An illustrative example makes the arithmetic vivid. Suppose a chain sells 100 dong of goods. It pays 80 dong to suppliers, leaving a 20% gross margin. Rent takes 5 dong, staff take 7, logistics and utilities take 3, headquarters and marketing take 2. That leaves 3 dong of operating profit — a 3% margin — before interest and tax. Now notice what happens if anything slips. If competition forces prices down just 2%, operating profit falls from 3 dong to 1: a one-third price war becomes a two-thirds profit collapse. If rent rises one percentage point, a third of the profit is gone. This is what analysts mean when they say retail has high operating leverage on thin margins: small changes at the top of the income statement produce violent changes at the bottom.
Why thin margins can still make a wonderful business
If margins are so fragile, why do investors love great retailers? Because profitability is not margin — it is margin multiplied by how hard the capital works. The concept that matters here is asset turnover: revenue divided by the assets used to generate it. A retailer flips its inventory many times per year, collects cash from customers instantly (nobody buys groceries on ninety-day credit terms), and often pays its own suppliers weeks later. That combination means a well-run chain can earn a high return on the capital actually tied up in the business despite a low margin on each sale. A 3% net margin turned over five times a year is a very different machine from a 3% margin turned over once.
This also explains retail’s most underrated weapon: negative working capital. Working capital is the money tied up in running the business day to day — inventory plus receivables minus payables. When a chain sells goods for cash today but pays suppliers in thirty or forty-five days, the suppliers are effectively financing the inventory. The bigger the chain grows, the more of this free float it holds. In the best cases, growth partly funds itself: each new store generates supplier credit that helps pay for the next one. When you screen a Vietnamese retailer, comparing how many days it holds inventory against how many days it takes to pay suppliers tells you who has this weapon and who does not — the raw ingredients are all in the financial statements, and a platform like vwealth computes these ratios for you from the latest filed reports so you do not need to build the spreadsheet by hand.
| Layer of the P&L | What it measures | What kills it | What protects it |
|---|---|---|---|
| Gross margin | Markup over supplier cost | Price wars, weak purchasing power, product mix shifting to commodities | Scale purchasing, private-label goods, high-margin services attached to products |
| Operating margin | Profit after store and HQ costs | Rising rents and wages, stores too young or too empty, bloated headquarters | High sales per store, disciplined store standards, logistics density |
| Net margin | What shareholders keep | Debt-funded expansion (interest), tax, losses in new ventures | Negative working capital, self-funded growth, mature store base |
Keep this table in mind, because every disaster story in Vietnamese retail — and there have been several across market cycles — maps onto one of these rows. Chains that expanded on borrowed money into formats with no gross-margin advantage found that all three layers failed at once.
The Three Numbers That Separate Great Chains from Doomed Ones
You cannot judge a retail chain by revenue growth alone, because revenue growth is the easiest thing in retail to buy: just open more stores. A chain doubling its store count will roughly double revenue even if every individual store is mediocre. The skill is in reading the three metrics that reveal whether the underlying machine is healthy. These are the numbers professional analysts pull out first, and they should be the first things you look for in any Vietnamese retailer’s disclosures or in the sector dashboards on vwealth.
Same-store sales growth: the truth serum
Same-store sales growth — often abbreviated SSSG, and sometimes called like-for-like growth — measures revenue growth only at stores that have been open for at least a year, stripping out the effect of new openings. It answers the one question expansion can hide: are the stores we already have getting stronger or weaker?
The logic of why this matters is simple. Total revenue growth = growth from new stores + growth at existing stores. If a chain reports 30% revenue growth but its same-store sales are falling 5%, the headline number is a mirage: the company is papering over decaying stores with new openings, and the moment expansion stops, total growth goes negative. Conversely, a chain with modest total growth but strong positive SSSG has a healthy core that will compound even without a single new opening.
An illustrative example: suppose chain A grows revenue 25% with SSSG of +8%, while chain B grows revenue 25% with SSSG of −3%. Identical headlines, opposite realities. Chain A’s mature stores are attracting more customers or larger baskets each year — a sign the format resonates. Chain B is running on a treadmill that speeds up every quarter: it must open ever more stores just to offset the decay of the old ones, and every new store it opens will itself start decaying after year one. When Vietnamese retailers disclose SSSG in investor presentations, read it before anything else. When they conspicuously stop disclosing it, treat the silence as data.
Store payback period: how fast a new store returns its cost
The second number is the store payback period: how many months or years a newly opened store takes to earn back the money invested in opening it (fit-out, equipment, initial inventory, pre-opening costs). This single figure compresses the entire unit economics of the format. A format where a store costs, illustratively, 3 billion dong to open and generates 1.5 billion dong of store-level cash profit per year pays back in two years — meaning the chain can recycle capital quickly, and even stores that eventually face new competition have already returned their cost. A format that pays back in six or seven years is a bet that nothing changes in Vietnamese retail for seven years, which history suggests is a bad bet.
Payback also determines how fast a chain can expand without leaning on debt or diluting shareholders. Short payback means yesterday’s stores finance tomorrow’s. Long payback means expansion must be funded externally — with borrowed money whose interest eats the thin margin, or new shares that dilute your ownership. When management announces an aggressive rollout target, your first question should always be: what is the payback on the format, and who is paying for the rollout?
Store-level versus company-level profitability
The third lens is the distinction between a profitable store and a profitable company. A store is profitable when its own revenue covers its own costs — rent, staff, stock losses. But the company sits above the stores, carrying headquarters, warehouses, logistics fleets, IT systems and management salaries. A young chain can have hundreds of individually profitable stores and still report a company-level loss, because the store network is not yet large enough to cover the fixed central costs spread across it.
This is not necessarily a problem — it can be the normal shape of a chain mid-build, as the next sections explain — but it defines the concept of scale threshold: the number of stores at which store-level profits finally exceed central costs. Management teams usually know this number and sometimes disclose it. Chains below their scale threshold are racing against their funding; chains far above it gush cash. Misjudging where a company sits on this curve is the single most common analytical error investors make with Vietnam retail stocks, and it flows directly into the valuation mistakes covered later in this guide.

The Four Battlegrounds: Electronics, Grocery, Pharmacy and Jewelry
“Retail” on the Vietnamese stock exchange is not one industry. The listed chains compete in at least four distinct categories, and each one has different margins, different maturity, different e-commerce exposure and a different investment logic. Comparing a grocery chain’s margins to a jewelry chain’s is like comparing a fish to a bicycle. Here is how the four main battlegrounds differ.
Consumer electronics: the mature battlefield
Phones, laptops and home appliances were the first categories that Vietnamese modern trade conquered, for a structural reason: electronics are standardized, high-ticket items where shoppers fear counterfeits, so the chain’s authenticity guarantee is worth the most. The consequence of early success is early maturity. Modern-trade penetration in electronics is far higher than in groceries, which means the land-grab phase is largely over: growth now comes from same-store gains, market-share capture from weaker rivals, and adjacent services rather than from opening stores in untouched territory.
Mature also means competitive. Electronics retail carries low gross margins because the products are identical everywhere and price comparison is effortless — exactly the dynamic that makes the category e-commerce’s favorite hunting ground, as the next section explores. The chains’ responses have been to attach higher-margin services (installation, warranties, financing), push into product categories where advice still matters, and squeeze costs through logistics density. Investors should read electronics retailers as market-share and efficiency stories, not as penetration stories, and should watch SSSG obsessively, because the demand cycle for phones and appliances swings with consumer confidence: big-ticket purchases are the first thing households postpone when times tighten. The category also overlaps with the technology hardware theme covered in our guide to Vietnamese technology stocks — the products are technology, but the retailing of them is pure consumer cyclicality.
Grocery: the biggest prize, the hardest economics
Food and daily necessities are by far the largest slice of Vietnamese household spending, and the slice where traditional trade — wet markets above all — still dominates. That combination makes grocery the biggest prize in the entire sector: whoever cracks organized food retail at scale owns the largest recurring spending pool in the country, with demand that barely flinches in recessions because people eat regardless of GDP.
It is also the hardest format to get right, for reasons the failures of multiple chains (local and foreign) have demonstrated across the past decade. Fresh food spoils, so inventory management errors literally rot. Vietnamese shoppers are exacting about freshness and accustomed to buying it daily from markets, so the chain must beat the wet market on quality perception, not just convenience. Baskets are small and frequent, so store economics depend on high traffic rather than high tickets. And gross margins on fresh goods are modest, so the format only works with ruthless supply-chain efficiency and enough store density to make each delivery truck route profitable. Grocery chains therefore tend to lose money for years while building density — the clearest case of the expansion J-curve described below. Vietnam’s own recent history illustrates this vividly: the country’s two largest modern grocery chains — the mini-mart networks run by leading listed retail groups — each ground through most of a decade of losses before finally turning their first sustained operating profits around 2024, once store density and per-store sales crossed the threshold that spreads central costs. By 2025, one of them was operating in the region of 2,200 stores and the other above 4,000, and both were guiding toward materially higher profit — a real-world demonstration that the model can work, but only after the long loss-making build. The investor’s question for a grocery format is not “is it profitable today?” but “is store-level profitability proven, and is density rising fast enough to cross the scale threshold before funding runs out?”
Pharmacy: the fastest migration
Medicine may be the category where the trust argument for modern trade is strongest: the fear of counterfeit or mishandled drugs makes the chain pharmacy’s guarantee genuinely valuable, and regulatory tightening on prescription control and drug traceability structurally favors organized players over the tens of thousands of independent pharmacies that have historically dominated. This is why chain pharmacy has been among the fastest-growing modern-trade formats in Vietnam, with several major retail groups racing to consolidate a deeply fragmented market. The race, though, has produced clear winners and losers rather than a rising tide lifting all boats: by mid-2025, the front-runner chain (backed by a listed retail group) had pushed past 2,000 stores and kept expanding at a roughly 25% annual clip, according to Nikkei Asia, while two once-prominent rivals spent 2023–2025 closing under-performing outlets and shrinking their networks to stem losses. That divergence is the pharmacy version of the store-level economics lesson: small-format stores are cheap to open, but opening them faster than you can staff and fill them destroys the very payback advantage that makes the format attractive.
The economics sit between electronics and grocery: gross margins are healthier than electronics because drugs are less price-transparent and the pharmacist’s advice adds value, while stores are small and cheap to open, keeping payback periods attractive. The risks are specific: pharmacy is a regulated business where rules on prescription drugs, pricing and store licensing can shift; competition among the expanding chains for prime small-format locations pushes up rents; and the race to consolidate can tempt chains into opening faster than they can train qualified pharmacists. Watch store productivity (revenue per store per month) as chains scale — if it falls persistently while store count rises, the chain is saturating its own catchments.
Jewelry: retail wearing a luxury mask
Gold and jewelry retail is the odd member of the group. Vietnamese households have a deep cultural affinity for gold as a store of value — a habit born of decades of currency instability — which gives jewelry chains a customer base that shows up in both good times (weddings, gifting, rising incomes) and nervous times (gold buying as savings). The branded chains are taking share from thousands of family gold shops for the familiar trust reason: certified purity, transparent pricing and hallmarked craftsmanship matter enormously when the product’s value is invisible to the naked eye.
The margin structure is unusual. Plain gold bars carry wafer-thin margins — they are near-commodities. Fabricated jewelry carries far higher gross margins because design, branding and craftsmanship are part of the price. So the profitability of a jewelry retailer depends heavily on its product mix, and the same revenue number can hide very different profit outcomes depending on how much of it came from bars versus branded pieces. Jewelry is also the most discretionary of the four categories: weddings can shrink, gifting budgets can tighten, and gold-price volatility swings both demand and inventory values. Read jewelry chains as premium consumer discretionary businesses with a commodity component, and always check the mix before celebrating a revenue beat.
| Battleground | Modern-trade maturity | Gross margin character | Key growth driver | Main risk to watch |
|---|---|---|---|---|
| Electronics | High — land grab mostly over | Low; commoditized products | Market share, services, SSSG | E-commerce price war; demand cycles |
| Grocery | Low — wet markets still dominate | Modest; fresh food is hard | Penetration and store density | Long loss-making build phase; execution |
| Pharmacy | Low but rising fast | Healthy; advice adds value | Consolidating fragmented market | Regulation; over-expansion vs staffing |
| Jewelry | Medium; branded share rising | Split: thin on bars, rich on fabricated | Trust migration, income growth | Discretionary demand; gold price swings |

E-Commerce: The Threat That Forced Retailers to Become Hybrids
No analysis of Vietnam retail stocks written in the 2020s can treat physical chains in isolation, because a meaningful and growing share of Vietnamese shopping now happens on e-commerce platforms and social channels. Vietnam’s online shopping adoption is among the most enthusiastic in Southeast Asia, powered by a young, smartphone-native population and hyper-cheap delivery in dense cities. The scale is no longer marginal: combined gross merchandise value across Vietnam’s largest online platforms reached roughly USD 16 billion in 2025, up about 26% year on year, and the market has hardened into a near-duopoly — as reported by The Investor, the two leading platforms together took the overwhelming majority of platform GMV in 2025, with the live-streaming “shoppertainment” newcomer growing far faster than the incumbent. For investors in listed chains, the essential task is to understand where e-commerce genuinely destroys chain economics, where it does not, and what a credible response looks like.
Where e-commerce bites hardest
E-commerce wins where products are standardized, price-comparable, easily shipped and require no urgency or advice. That description fits a large share of consumer electronics accessories, small appliances, fashion and packaged goods — and it explains why electronics retailers felt the pressure first and hardest. When a shopper can see the exact same headphone model on a platform at a lower price with next-day delivery, the physical store’s costs (rent, staff) become a competitive liability. The platforms, subsidized during their own land-grab years by international investors, were often willing to lose money on each sale to win the customer, forcing physical chains to match prices with real-world cost structures.
Where physical retail keeps structural advantages
E-commerce bites far less in categories where immediacy, freshness, trust or regulation dominate. Fresh groceries resist pure online models because delivery of perishables is expensive and Vietnamese shoppers want to inspect freshness. Medicine is regulated and often needed within the hour. High-value jewelry demands physical inspection and in-person trust. Big-ticket appliances need delivery and installation anyway, which the chains’ logistics networks already do well. And across every category, the store network itself turns out to be an e-commerce asset: a chain with hundreds of locations can offer click-and-collect, use stores as delivery hubs cutting the last-mile cost that bleeds pure online players, and handle returns in person — things a warehouse-only competitor cannot match.
Omnichannel: the response that actually works
The strategy the surviving chains converged on is called omnichannel — treating the website, the app and the physical stores as one integrated system rather than separate businesses. The shopper researches on the app, checks stock at the nearest store, collects in person or gets same-day delivery from that store rather than a distant warehouse, and returns through any channel. Done well, omnichannel converts the chain’s expensive store network from a liability (versus pure online) into a moat: the online-only player must build logistics that the chain already owns.
When you evaluate a listed retailer’s e-commerce defense, ignore the press releases and ask three verifiable questions. First, what share of revenue is online, and is the company willing to disclose it consistently? Second, is online growth coming with margins, or is the chain buying online revenue with discounts that destroy the economics it defended in stores? Third, does the logistics story hold — are stores genuinely used as fulfillment points, shortening delivery times below what platforms achieve? Chains that answer all three convincingly have turned the threat into an advantage. Chains that answer none are hoping the problem goes away, and it will not.
Why the Best Retailers Sometimes Report the Worst Profits: The Expansion J-Curve
Here is the counterintuitive heart of retail investing, and the source of both the biggest mistakes and the biggest opportunities in the sector: a chain in aggressive expansion mode systematically reports profits far below its true earning power. Investors who read the income statement naively will conclude the business is weak precisely when it is planting the seeds of its most valuable years. Understanding this J-curve — profits that dip before they soar — is what separates informed analysis of Vietnam retail stocks from P/E-screen tourism.
The mechanics: new stores are loss-makers by design
A newly opened store starts life unprofitable. It pays full rent and full staff costs from day one, but its sales start low: shoppers take months to change habits, discover the store and make it part of their routine. A typical new store might need six months to two years — depending on format — to ramp up to mature sales levels. During that ramp, it drags on company profits. Now imagine a chain growing its store count 40% in a year. A huge fraction of its total network is immature at any moment, all of it dragging on the consolidated income statement, while the costs of the expansion itself — site scouting teams, training academies, warehouse capacity built ahead of need — pile into overheads. The chain’s mature stores may be printing money, but the consolidated report shows thin profits or outright losses.
An illustrative example: suppose a chain has 100 mature stores each producing 2 billion dong of annual store-level profit, and it opens 60 new stores that each lose 1 billion dong in their first year while ramping. Mature stores contribute 200 billion; new stores subtract 60; central costs take another 80. Reported operating profit: 60 billion. Now let the same chain simply stop expanding and let the 60 stores mature into 2-billion earners: profit becomes 100 × 2 + 60 × 2 − 80 = 240 billion — four times the reported figure, with zero improvement in the underlying business. The expansion was hiding three-quarters of the earning power. This is why analysts speak of steady-state earnings: what the company would earn if it stopped growing and let the existing network mature. Steady-state earnings, not reported earnings, are the honest base for valuing an expanding retailer.
The trap in both directions
The J-curve cuts both ways, and each direction has claimed victims. In one direction, investors dump an expanding chain because its P/E ratio — price divided by reported earnings — looks absurdly high, without noticing that the E is artificially depressed by immature stores. They are effectively charging the company a valuation penalty for investing in its own future. In the other direction, investors assume every loss-making expansion is a hidden gem, forgetting that the J-curve argument only works if the mature stores are genuinely profitable. A chain whose mature stores barely break even is not hiding earning power behind expansion; it is scaling a broken model, and every new store digs the hole deeper. The difference between the two cases is exactly the store-level economics from earlier: proven payback and healthy mature-store profitability turn expansion losses into an investment; unproven unit economics turn them into a bonfire.
So before applying the J-curve defense to any Vietnamese retailer, demand the evidence: disclosed store-level profitability for mature cohorts, a stated and plausible payback period, and SSSG that shows mature stores strengthening rather than decaying. Where management provides cohort data — sales curves of stores opened in different years — study it; it is the closest thing retail offers to a controlled experiment.

Reading a Retailer’s Quarter: The Numbers That Actually Matter
Quarterly reports from retail chains bury the signal under headline revenue and net profit, both of which the expansion dynamics above can distort beyond usefulness. Here is a practical reading order — the sequence a sector analyst actually follows when a Vietnamese retailer publishes results. Pulling these numbers takes minutes on a platform that has already digested the filings; the point is knowing which ones to look at and in what order. If you are new to accessing Vietnamese company disclosures in the first place, our guide on how to invest in the Vietnamese stock market covers where filings live and how foreign investors get set up.
Step one: decompose revenue growth
Split total revenue growth into store-count growth and same-store growth. If the company discloses SSSG, use it; if not, approximate by comparing revenue growth to average store-count growth. Growth driven by SSSG is high-quality and sustainable; growth driven purely by openings is bought, and its quality depends entirely on the unit economics of the new stores. A deceleration in SSSG while openings accelerate is the classic pattern of a chain masking decay — flag it immediately.
Step two: check gross margin against the mix story
Compare gross margin to the same quarter a year earlier (retail is seasonal — Lunar New Year quarters are not comparable to mid-year quarters, so year-on-year beats quarter-on-quarter). A falling gross margin means price competition or a mix shift toward lower-margin products; verify which by reading the category disclosure. A rising gross margin during a price war is suspicious — check whether the company is capitalizing costs or changing accounting estimates rather than genuinely improving.
Step three: follow the expansion math
Count net new stores, note the disclosed capex, and update your view of the maturity mix: what fraction of the network is under two years old? Then look at operating expenses as a percentage of revenue. In a healthy expansion, this ratio holds steady or improves slowly as scale spreads central costs; a ratio deteriorating faster than the immature-store share explains is a sign expansion discipline is slipping.
Step four: interrogate inventory and cash
Inventory is where retail problems appear first, quarters before they reach the income statement. Compute inventory days — inventory divided by daily cost of goods sold — and compare across quarters. Rising inventory days without a stated reason (new stores need initial stock; a strategic pre-buy ahead of price increases) means goods are not selling, and future markdowns will crush gross margin. Then check operating cash flow against reported profit. A retailer’s profits should convert to cash quickly given cash-paying customers; persistent divergence between profit and operating cash flow is one of the most reliable red flags in the sector. Finally, glance at supplier payables: a chain stretching payments dramatically may be substituting supplier patience for real funding.
Step five: listen for the qualitative tells
Management commentary carries information the tables do not. Watch for silent disappearance of previously disclosed metrics (SSSG that vanishes after a bad quarter), rollout targets that quietly shrink, and new-venture enthusiasm that outruns evidence — retail conglomerates have a habit of announcing entries into hot new formats at the exact top of investor enthusiasm for them. Consistency of disclosure across years is itself a quality signal.
Valuing Vietnam Retail Stocks Without Fooling Yourself
Valuation in this sector fails in predictable ways, all of them downstream of the dynamics already covered. Three adjustments keep you honest.
First, never apply a raw P/E to an expanding chain. As the J-curve section showed, reported earnings during expansion understate earning power, so a headline P/E overstates expensiveness — and the reverse for a chain that has just stopped growing, whose earnings pop while its future dims. Estimate steady-state earnings from mature-store economics and value those, or use revenue-based multiples cross-checked against the margin a proven mature network achieves. Comparing enterprise value per store against the profit a mature store generates is a useful sanity check that sidesteps the income statement’s distortions entirely.
Second, price the funding, not just the story. An expansion plan is only as good as its financing. Dilution from repeated share issuance can quietly consume the per-share benefit of network growth: a chain that doubles profit while increasing share count 60% has delivered far less than the narrative suggests. Track per-share metrics, always.
Third, respect the cyclical layer on top of the structural one. The modern-trade migration is structural, but retail demand — especially electronics and jewelry — swings with consumer confidence, credit availability and property-market wealth effects. The market routinely extrapolates boom-quarter demand into permanent growth rates and despair-quarter demand into permanent decline. The structural trend gives you the confidence to buy quality chains during demand winters; the cyclical layer warns you against paying peak multiples on peak earnings. Position sizing and diversification principles apply here as everywhere: even the best retail thesis is one thesis, in one sector, in one economy.
Putting It Together: A Working Checklist for the Sector
The traditional-to-modern migration makes Vietnamese retail one of the clearest decade-scale stories on the exchange — clearer, arguably, than any other domestic demand theme because progress is countable in stores, disclosed in SSSG, and testable in unit economics. But the sector pays that clarity back in difficulty: margins thin enough that small mistakes are fatal, expansion accounting that misleads naive readers in both directions, four battlegrounds with entirely different rules, and an e-commerce rival that has permanently changed what a defensible store network looks like.
Condense this guide into the questions to ask of any listed Vietnamese retailer: Which battleground does it fight on, and how mature is modern trade there? Are mature stores demonstrably profitable, with a payback period short enough to self-fund growth? Is SSSG positive and disclosed consistently? How much of reported profit is being suppressed — or flattered — by the expansion phase? Do inventory days and operating cash flow confirm the income statement? Is the omnichannel response real, measured in online revenue share and store-based fulfillment, or rhetorical? And is the valuation anchored to steady-state economics per share rather than to a headline multiple on distorted earnings? A retailer that clears all seven questions is rare; the exercise of asking them will disqualify most candidates quickly, which is exactly what a good checklist is for. From there, the ongoing work is quarterly: rerun the five reading steps each earnings season and let the cohort data, not the narrative, update your thesis.
This article is a reference framework for your own analysis, not investment advice or a recommendation to buy or sell any security.
Research Vietnamese stocks in English with vwealth. Our AI-powered platform turns Vietnamese market data into full English analysis reports — with international payment support and a free 2-month trial for new accounts. Create your free account and read the latest reports.