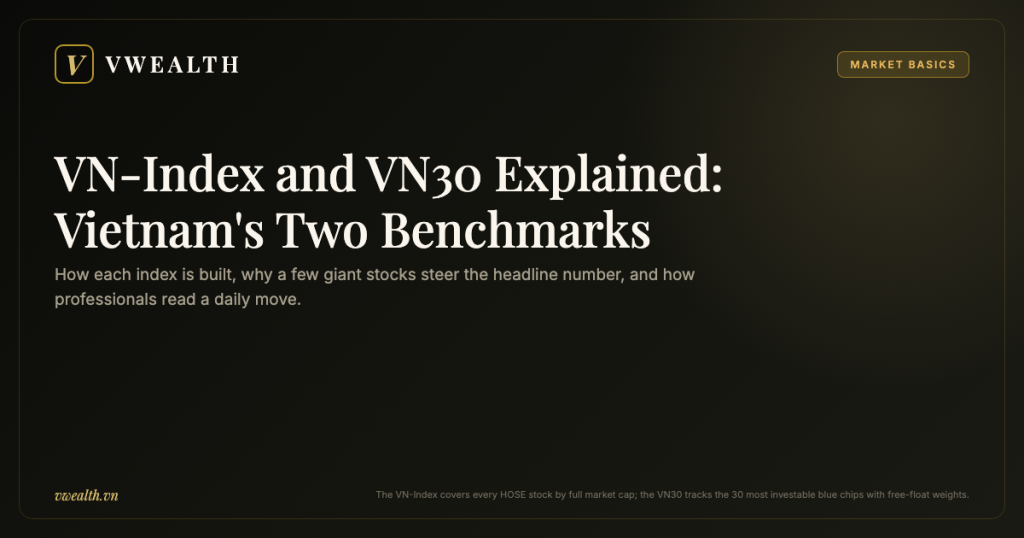
Turn on any Vietnamese business channel and the first number you will hear is the VN-Index. It is quoted like a national mood ring: up and the market is “green”, down and headlines turn grim. Yet very few investors — local or foreign — can explain what the VN-Index actually measures, why a single conglomerate can drag it down on a day when most stocks rise, or why professional money managers quietly watch the VN30 instead. This guide takes both benchmarks apart: how the vn-index is built, where its blind spots are, how the VN30 basket is selected, and how to read a daily move without being fooled by it.
What the VN-Index actually measures — and what it does not
The VN-Index is the headline stock index of the Ho Chi Minh City Stock Exchange, known by its English acronym HOSE. An index, in plain terms, is a single number that summarizes the combined value of a group of stocks so you can track the group over time instead of watching hundreds of tickers one by one.
Three design choices define the VN-Index, and each one shapes how you should interpret it:
First, it covers every stock listed on HOSE. Not a selection, not the “best” companies — all of them. If a company is listed on the Ho Chi Minh exchange, it is in the index, whether it is a giant bank or a small construction firm nobody trades. This makes the VN-Index a broad market gauge, but only for one of Vietnam’s three trading venues. Stocks on the Hanoi exchange (HNX) and the UPCoM board — the market for unlisted public companies — are tracked by separate indices. If you are still mapping out the landscape, our explainer on how HOSE, HNX and UPCoM differ covers why the most valuable Vietnamese companies concentrate on HOSE in the first place.
Second, it is weighted by market capitalization. Market capitalization — “market cap” — is simply a company’s share price multiplied by its number of listed shares; it is what the whole company is worth at today’s price. In a cap-weighted index, bigger companies count for more. A 2% move in one of the largest banks moves the index far more than a 20% move in a small industrial stock. This is the single most important thing to understand about the VN-Index, and we will spend a full section on its consequences.
Third, it measures price only. The standard VN-Index does not add back dividends. When a company pays a cash dividend, its share price drops by roughly the dividend amount on the ex-dividend date — the day new buyers no longer receive the payout — and the index absorbs that drop as if value vanished. Over many years, this means the index understates what a buy-and-hold investor actually earned, because real investors pocket those dividends. A separate “total return” version (VN-Index TR) exists that reinvests dividends, but the number quoted in the news is the plain price index.
One more piece of context helps: the index has history. The VN-Index launched on July 28, 2000 with a base value of 100 points and exactly two listed stocks — the refrigeration engineering company REE and the cable maker SACOM (ticker SAM). Every value since then is a multiple of that starting point. When the index trades at 1,800, it means the aggregate market value of HOSE-listed companies (adjusted for listings, delistings and share issuance along the way) is eighteen times the base level of mid-2000. The index famously closed at 1,170.67 points on March 12, 2007 at the peak of that era’s bubble, collapsed to around 235 points in February 2009 during the global financial crisis, and needed more than a decade — until 2018 — to reclaim the 2007 high. The post-COVID retail boom then carried it to a new record close of 1,528.57 on January 6, 2022, a peak that stood through the brutal 2022 bear market until it was finally broken in 2025. That breakout turned into the strongest run in the market’s history: on October 8, 2025 — the day FTSE Russell announced Vietnam’s reclassification from frontier to secondary emerging market status (effective September 21, 2026) — the index closed at a then-record 1,697.83, and by May 2026 it had pushed to all-time highs above 1,900 points before settling near 1,860 at the end of June 2026. These levels carry emotional anchors for Vietnamese investors that a newcomer may not see.
How the VN-Index is calculated, step by step
You do not need to compute the index yourself — HOSE does it continuously during trading hours — but walking through the arithmetic once immunizes you against several common misreadings.
The core formula compares total market value today against total market value at the base date:
VN-Index = (Current total market capitalization ÷ Base market capitalization) × 100
The “base market capitalization” is not literally the market value from July 2000. It is an adjusted divisor that HOSE updates whenever something changes the market’s size without reflecting genuine price movement — a new company listing, a delisting, a large share issuance. The adjustment keeps the index continuous: if a huge company lists tomorrow, total market cap jumps, but the divisor is scaled up at the same time so the index does not artificially spike.
An illustrative example makes the weighting effect concrete. Suppose — purely as a teaching model — a miniature market with three stocks:
| Stock (illustrative) | Share price | Shares listed | Market cap | Weight in index |
|---|---|---|---|---|
| Big Bank A | 40,000 VND | 5 billion | 200 trillion VND | 66.7% |
| Mid Retailer B | 60,000 VND | 1.5 billion | 90 trillion VND | 30.0% |
| Small Builder C | 10,000 VND | 1 billion | 10 trillion VND | 3.3% |
Total market cap: 300 trillion VND. Now run one trading day. Big Bank A falls 3%, wiping 6 trillion off its value. Small Builder C surges 7% — the maximum allowed in a single HOSE session — adding just 0.7 trillion. Mid Retailer B is flat. The market’s total value drops from 300 to 294.7 trillion, so this three-stock index falls about 1.8% — even though two of three stocks did not fall, and one had its best possible day. Scale this up to hundreds of stocks and you have the daily reality of the VN-Index: the giants steer, everyone else is a passenger.
Notice also what the calculation ignores. It does not care how many shares actually changed hands. A stock can drift down 2% on tiny volume — a few sellers, no conviction — and subtract exactly as many index points as a 2% drop on a panicked, high-volume rout. The index is a price snapshot, not a measure of intensity. That is why experienced readers always check trading value (total money that changed hands) alongside the index move, a habit we will formalize later in this article.
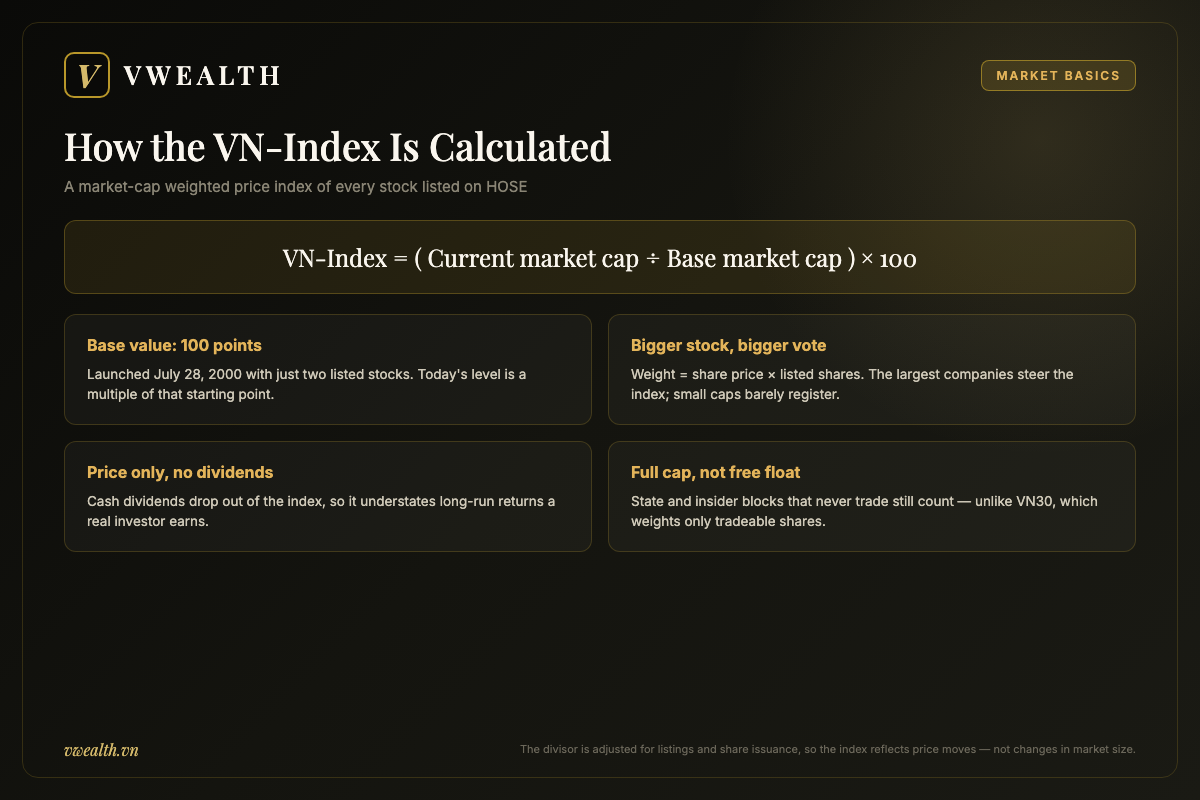
A final calculation detail matters for foreigners comparing Vietnam to developed markets: the headline VN-Index behaves, in practice, as a full market capitalization index, counting every listed share — including huge blocks held by the State, by founding families, or by strategic partners that never trade — and it applies no cap on any single stock’s weight. Most modern global indices instead use free-float weighting, which counts only shares realistically available for public trading. Vietnam’s investable index family — the VN30, VN100, VNMidcap, VNSmallcap and VNAllshare, governed by HOSE’s Ground Rules for the HOSE-Index Series (the current Version 4.0 was issued on December 30, 2024 and took effect in March 2025) — is free-float adjusted and capped; the headline VN-Index is not treated this way. The consequence is visible in today’s index: as of mid-2026, Vingroup (VIC) — a conglomerate in which the founding family and related parties hold the large majority of shares — alone accounted for close to one-fifth of the VN-Index’s capitalization weight, according to Vietnamese financial press coverage. A company where insiders hold most of the shares can carry enormous index weight relative to how much of it you could actually buy.
The concentration problem: when five stocks are the market
Every cap-weighted index concentrates influence at the top — the S&P 500’s largest names dominate it too. But Vietnam’s version of the problem is sharper, for structural reasons worth understanding rather than memorizing.
The Vietnamese listed market is young and its largest companies are very large relative to the rest. A handful of groups — the biggest private conglomerate, the state-linked banks, a dominant food-and-beverage producer, the leading gas and utilities names — have historically accounted for a strikingly high share of total HOSE capitalization. The exact percentages shift year to year (open a current market report on vwealth to see today’s figures rather than trusting any number printed here), but the pattern has been persistent for over a decade: the top ten stocks routinely represent somewhere near half of the entire index’s weight.
This produces three recurring illusions you should learn to spot:
The green-index, red-portfolio day
The index closes up because two or three mega-caps rallied — perhaps on a corporate story that has nothing to do with the broader economy — while the majority of stocks declined. Your diversified portfolio of mid-sized companies loses money on a day the news calls positive. The reverse also happens: broad small-cap rallies that the index barely registers because the giants sat still. Neither day tells you much about “the market”; both tell you about a few tickers.
The single-stock index event
Occasionally one conglomerate’s stock moves so violently — a major corporate announcement, a foreign block trade, a margin-call cascade — that it alone accounts for the majority of the index’s daily change. Financial media will report “Vietnam stocks plunge”; the accurate headline would be “one very heavy stock plunged.” The first half of 2026 supplied a textbook illustration: by late June 2026, Vietnamese financial media calculated that the VIC–VHM pair of Vingroup-family stocks had contributed roughly 180 index points since the start of the year — during a period in which the VN-Index itself rose only around 90 points, meaning the rest of the market, netted together, had subtracted points even as the headline index climbed. Before reacting to any dramatic index move, decompose it: which stocks contributed the points? Every decent market data terminal, including the daily market screens on vwealth, shows an index-contribution table for exactly this reason.
The valuation mirage
Commentators often quote “the market P/E” — the price-to-earnings ratio of the whole index, meaning how many years of current profits investors are paying for the market. A price-to-earnings ratio, at first mention, is simply price divided by annual earnings per share; lower generally means cheaper. Because the index P/E is dominated by its heaviest sectors — and in Vietnam that means banks, which structurally trade at low P/E multiples everywhere in the world — the aggregate number can look “cheap” while the median stock is expensive, or vice versa. A market P/E of, say, 12 driven mostly by banks at 8 can coexist with consumer stocks at 25. Aggregate valuation statistics deserve the same decomposition discipline as daily moves.
None of this makes the VN-Index useless. It remains the correct long-run gauge of aggregate Vietnamese equity value, and its multi-decade chart genuinely tracks the country’s capital-market development. The lesson is narrower: daily and weekly index readings are noisy, top-heavy signals, and serious analysis always asks what happened beneath the surface.

VN30: the institutional benchmark, and how a stock gets in
The VN30 Index was created by HOSE (launched on February 6, 2012) to solve precisely the problems described above. It tracks 30 stocks — the largest, most liquid, most investable companies on the exchange — using rules closer to international index standards. The basket is genuinely representative: as of June 30, 2025, VN30 constituents accounted for 68.78% of the total market capitalization of all HOSE-listed stocks, according to HOSE. If the VN-Index is the market’s population census, the VN30 is its representative parliament.
Selection is mechanical, not editorial. No committee decides which companies are “good.” Twice a year, in scheduled reviews in January and July (with constituent changes applied at set effective dates shortly after each review), every HOSE stock is run through a screening funnel defined in HOSE’s published Ground Rules — currently Version 4.0, issued under Decision No. 747/QĐ-SGDHCM on December 30, 2024, effective March 2025, and first applied to constituent selection in the July 2025 review:
| Screening stage | What is tested | Why it exists |
|---|---|---|
| 1. Eligibility | Listing history and basic status — the stock must have traded long enough, must not be under warning, control or suspension | Excludes fresh listings and troubled companies whose prices are unreliable |
| 2. Market capitalization | Stocks ranked by size; the largest names advance | The index should represent where the market’s value actually sits |
| 3. Free float | The share of stock genuinely available to public investors must clear a minimum threshold (10% under HOSE’s published methodology) | A giant company whose shares are 95% locked up by the State is huge on paper but barely investable |
| 4. Liquidity | Stocks ranked by traded value; the most actively traded fill the final basket. Version 4.0 raised the bar sharply: minimum order-matching trading value rose from VND 10 billion to VND 30 billion, and minimum matched volume from 100,000 to 300,000 shares | Institutions must be able to enter and exit without moving the price against themselves |
| 5. Fundamentals (new in Version 4.0) | The company must report a non-negative net profit after tax in its latest audited or reviewed financial statements, with no audit disclaimers or qualified opinions | Ensures constituents are not only large and liquid but financially sound — a screen absent from earlier rule versions |
The new screens have teeth. In the July 2025 review — the first conducted under Version 4.0 — the insurer BVH was removed for failing the higher trading-value criterion and replaced by the chemicals group DGC.
Two further mechanics distinguish VN30 from its parent index. It is free-float weighted: a company’s weight reflects only its tradeable shares, so state-heavy giants are cut down to their investable size. And it applies weight caps: no single stock may exceed 10% of the index, related groups of stocks (such as companies belonging to the same conglomerate family) are capped at 15% combined, and — beginning with the April 2025 review under the Version 4.0 rules — no single sector may exceed 40% of the index. When a stock’s float-adjusted weight would breach a cap, it is scaled down and the excess redistributed. The caps are the direct answer to the single-stock-index-event problem — inside the VN30, no company can be more than a tenth of the story, and no conglomerate family more than 15% of it. The 40% sector cap was added specifically to rein in the index’s chronic overweight in financials, which HOSE’s own factsheet put at 54.3% of VN30 free-float weight at the end of 2024.
Why institutions watch VN30 rather than VN-Index
Professional investors gravitate to the VN30 for reasons that follow logically from its construction:
It is replicable. A fund can actually buy the VN30 basket in the stated weights, because every member is liquid and float-adjusted. Nobody can replicate the full VN-Index — hundreds of its constituents trade too thinly to absorb institutional money. An index you cannot buy is a statistic; an index you can buy is an investment product.
It underlies Vietnam’s derivatives market. When Vietnam launched stock-index futures in August 2017 — contracts that let traders bet on or hedge against the index’s future level — the underlying chosen was the VN30, not the VN-Index. To this day the VN30 futures contract is the country’s dominant derivative, which means enormous daily attention, hedging flow and arbitrage activity are anchored to VN30 levels. Around futures expiry dates, VN30 constituent prices can move for purely mechanical reasons, a quirk short-term traders learn quickly.
It underlies major ETFs. Several domestic exchange-traded funds — funds that trade on the exchange like a single stock and mechanically hold an index’s basket — track the VN30 directly. When money flows into these funds, the funds must buy the 30 constituents in index weights; outflows force selling. For a comparison of the main vehicles, their fees and their tracking quality, see our review of Vietnam ETFs and how to choose between them.
It filters the noise. Because every VN30 member is heavily traded, its prices reflect the continuous judgment of many participants, including foreign institutions. Small HOSE stocks can be moved — sometimes deliberately — by modest sums of money; VN30 stocks are far harder to push around. A divergence between VN30 and VN-Index performance is itself a useful signal: when small caps race far ahead of the blue-chip index, the rally is being driven by domestic retail speculation rather than institutional accumulation, a pattern that has historically marked late, fragile phases of market cycles.
The semi-annual rebalancing is worth one caution. Index inclusion and exclusion are announced in advance, and prices react: stocks entering the VN30 anticipate forced buying from ETFs and index-tracking funds, stocks leaving anticipate forced selling. Trading this effect is a crowded professional game; a long-term investor mainly needs to know that unusual volume and price behavior around review dates is often index plumbing, not new information about the business.
What Vietnam’s market is made of: sector composition
An index inherits the personality of its sectors, and Vietnam’s sector mix explains much of how both benchmarks behave.
The dominant weight, by a wide margin, is banking and financial services. Vietnamese banks are among the largest listed companies, and taken together with brokerages and insurers, financials have persistently been the heaviest sector block in both the VN-Index and especially the VN30: HOSE’s own factsheet put financials at 46.2% of the free-float-adjusted VNAllshare universe and 54.3% of the VN30 at the end of 2024 — the overweight that prompted the 40% sector cap introduced in 2025. The practical consequence: the Vietnamese indices are, to a first approximation, a leveraged bet on the domestic credit cycle. When credit growth is strong and bad debts are contained, banks report fat profits and the index tends to rise; when the property sector wobbles — banks being the property developers’ creditors — the index feels it immediately.
Real estate is the second defining block: residential and industrial-park developers plus the ecosystem around them. Property in Vietnam is both a huge industry and the population’s favorite store of wealth, so developer stocks are large, volatile, and tightly linked to policy — land law, credit quotas for property lending, corporate bond regulations. Several of the sharpest index drawdowns of recent memory originated in real-estate credit stress rather than in the general economy.
Consumer companies — food and beverage producers, retailers — form the third pillar, the classic play on Vietnam’s rising middle-class income. Industrials, materials and energy (steel, chemicals, oil and gas, utilities) add cyclical weight: steel stocks in particular have their own famous boom-bust rhythm tied to construction cycles and global steel prices. Technology exists but is thin on the listed market — one large IT-services group, FPT, carries essentially all of the sector’s index weight (at the end of 2024 it was the single largest free-float weight in the VN30, at about 13.5% before capping, per HOSE’s factsheet), which surprises investors who assume a fast-digitizing economy must have a tech-heavy stock market.
Compare this composition mentally with the S&P 500, where technology dominates, and you understand why the two markets can decouple: the VN-Index does not primarily price global tech sentiment; it prices Vietnamese credit, property and consumption. It also explains a persistent feature of the market’s valuation profile — banks’ structurally low price-to-earnings ratios pull the aggregate market P/E down, flattering headline “cheapness.”
Sector weights drift over time as companies grow, list and delist, so treat any static percentage with suspicion. The reliable habit is to check the current breakdown before drawing conclusions — the sector dashboards and English-language company reports in vwealth’s report library are updated continuously precisely so that readers do not have to rely on stale numbers embedded in articles like this one.
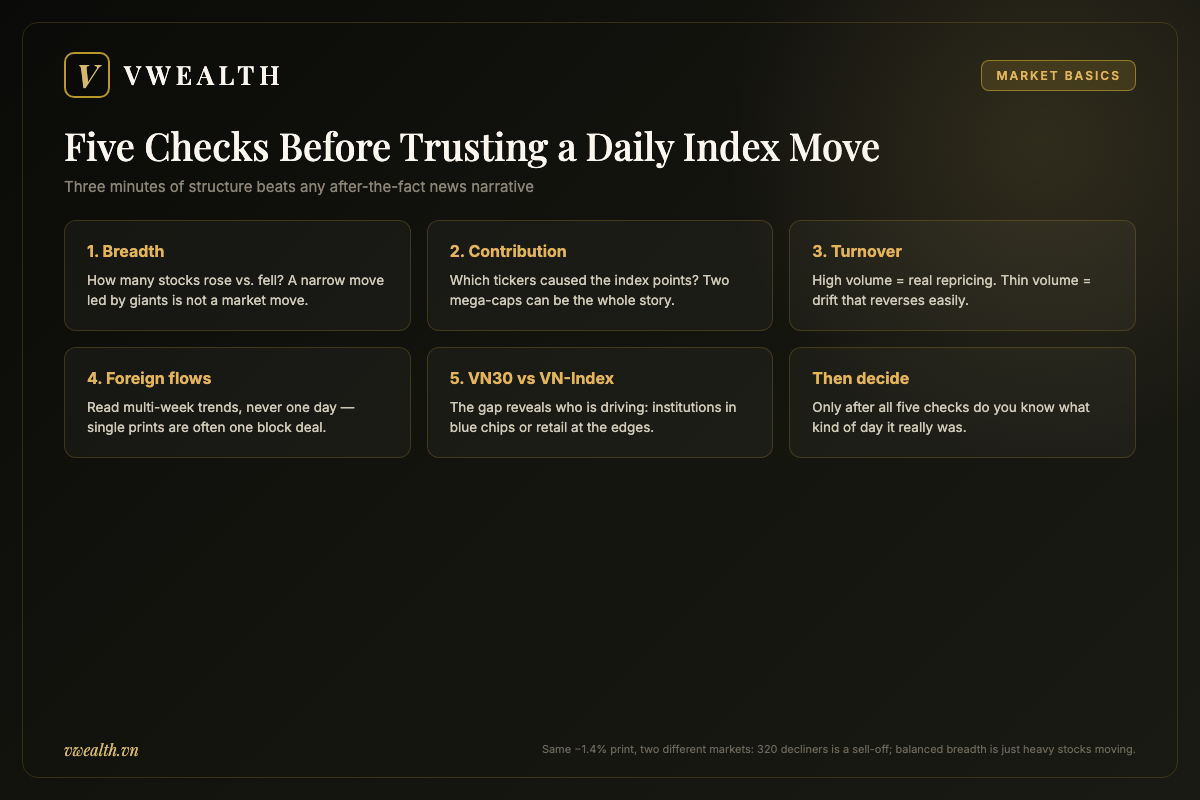
How to read a daily index move without fooling yourself
Now assemble the pieces into a practical routine. The index printed −1.4% today. Before forming any opinion, run five checks — together they take three minutes and they filter out most bad conclusions.
1. Check breadth: how many stocks actually fell?
Market breadth is the count of advancing versus declining stocks. A −1.4% day with 320 decliners against 60 advancers is a genuine broad sell-off. The same −1.4% with decliners and advancers roughly balanced means a few heavyweights fell and the average stock did nothing. These are entirely different events wearing the same headline. Breadth is published on every exchange summary; make it the first number you look at after the index itself.
2. Check contribution: which stocks caused the points?
Index-point contribution tables rank stocks by how many points each added or subtracted. If two related mega-caps account for the bulk of the decline — say, two companies in the same conglomerate family — you are looking at a corporate story, not a macro event. If the damage is spread across twenty stocks from different sectors, something systemic (foreign selling, margin pressure, a policy shock) is more plausible.
3. Check turnover: how much money changed hands?
Liquidity — total traded value — is the market’s conviction meter. A decline on unusually high turnover means sellers were aggressive and buyers absorbed size at lower prices: real repricing. A decline on thin turnover means buyers simply stepped away and prices drifted down through indifference; such moves reverse more easily. The same logic applies to rallies: a surge on weak volume is a suspect surge. Compare today’s traded value against the recent daily average rather than judging the raw number, since normal turnover levels shift across market phases.
4. Check foreign flows — with skepticism
Vietnamese market reports prominently display daily net foreign buying and selling. Foreign investors hold a meaningful minority of the market, and multi-week streaks of foreign selling or buying do correlate with market phases, so the trend is worth tracking. But a single day’s figure is noise, frequently dominated by one negotiated block deal — a pre-arranged transfer of a large stake that says nothing about market sentiment. Read foreign flows in multi-week accumulation, never in single prints.
5. Check the VN30 against the VN-Index
Finally, compare the two benchmarks’ moves. VN30 falling harder than VN-Index suggests institutions and blue chips are under pressure — often foreign-flow or derivatives-driven. VN-Index falling harder (or small-cap indices bleeding while VN30 holds) suggests retail speculation unwinding at the market’s periphery. Persistent divergence is one of the more reliable free indicators of who is driving the market, and it costs nothing to observe.
This checklist deliberately excludes reacting to news explanations. Daily market wrap-ups reverse-engineer a narrative onto whatever happened — the same inflation data will be cited as the reason for a rise on Tuesday and a fall on Wednesday. Structure (breadth, contribution, volume, flows) is evidence; after-the-fact narrative is decoration. If you are new to placing all of this in a complete investment process, our step-by-step guide to investing in the Vietnam stock market walks from opening an account through building an analysis routine.
Ceilings and floors: how Vietnam’s price limits shape index behavior
Vietnamese exchanges impose daily price bands — hard limits on how far any stock may move in one session, measured from its reference price (normally the previous close). On HOSE the band is ±7%; on HNX it is ±10%; on UPCoM, ±15%. A stock that rises 7% on HOSE hits its “ceiling” and simply cannot trade higher that day; at −7% it sits at the “floor”. Newly listed stocks get a wider band on their first trading day — ±20% on HOSE, ±30% on HNX and ±40% on UPCoM — after which the standard limits apply. These bands survived the market’s biggest infrastructure change in years: the Korean-built KRX trading system that went live on HOSE in May 2025 modernized order handling but left the daily price limits unchanged as of mid-2026.
Price limits exist to interrupt panic and give information time to spread. But they also produce index behaviors that do not exist in unlimited markets like the US, and misreading them is a classic newcomer error:
Crashes happen in installments. Suppose genuinely terrible news would justify a 20% repricing of a stock. On HOSE, that repricing physically cannot happen in a day. Instead the stock falls 7%, closes at the floor with a mountain of unfilled sell orders, opens at the floor again the next day, and again the day after. During severe market-wide stress, the index therefore declines in a chain of grinding sessions rather than one cathartic plunge. The dangerous illusion is the “small” daily number: −7% with millions of shares stacked at the floor and no buyers is a catastrophic print, not a moderate one. In such conditions the floor price is a queue, not a market — holders cannot actually exit at the displayed price.
Liquidity vanishes exactly when it is needed. A stock locked at floor with no bids has, effectively, zero liquidity: the displayed index level assumes prices at which actual selling is impossible. Margin lending amplifies this. Investors who borrowed from brokerages to buy stock face forced liquidation when prices fall; but if the stock is frozen at the floor, brokers cannot sell it and instead sell whatever can be sold — typically the liquid blue chips. This is the transmission mechanism by which distress in one speculative corner of the market suddenly hits the VN30: not contagion of fundamentals, but contagion of margin calls. It also explains why the highest-quality stocks sometimes fall hard on days dominated by trouble in low-quality names.
Ceiling chains mark speculative manias. The mirror image: a stock rising 7% day after day with buy orders stacked at the ceiling — a “ceiling chain” (locally, trần liên tiếp). Small-cap manias in Vietnam characteristically feature clusters of such stocks. Because these names carry trivial index weight, the VN-Index barely records the frenzy; watching breadth and the small-cap segment reveals it. When a mania breaks, the same stocks reverse into floor chains, and holders learn painfully that the exit door in a price-limited market is much smaller than the entrance.
For index reading, the summary rule is: in stressed or euphoric markets, supplement every index print with the counts of floor-locked and ceiling-locked stocks. Vietnamese market data pages publish these counts daily. Thirty stocks at the floor tells you more about the day than the index’s percentage change does.
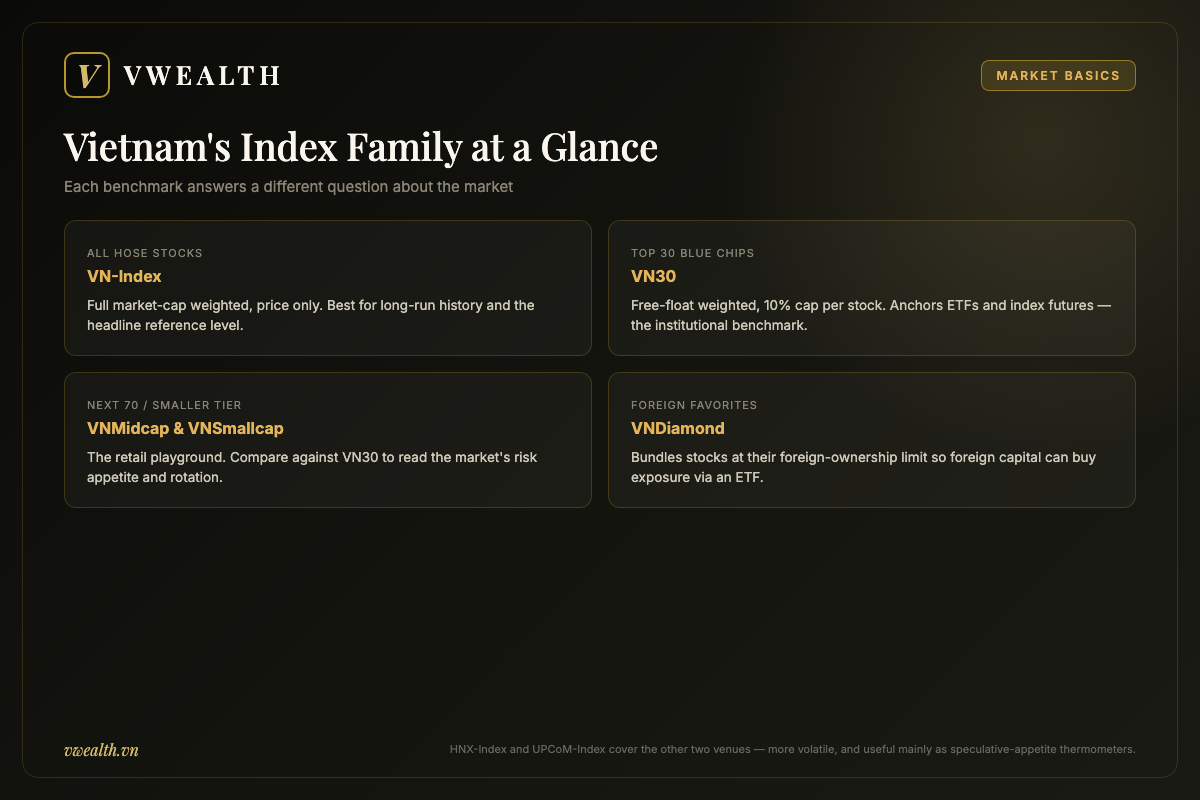
Beyond the big two: VNMidcap, VNDiamond and the rest of the index family
HOSE publishes a family of indices beyond the two headliners, and three of them earn a place in a practical investor’s vocabulary.
VNMidcap and VNSmallcap: the market’s second and third tiers
The VNMidcap tracks the 70 next-largest liquid stocks after the VN30; VNSmallcap covers the tier below that; VN100 combines VN30 and VNMidcap into a top-100 benchmark. Their value to you is diagnostic. Domestic retail investors — who account for the large majority of daily trading in Vietnam — favor mid and small caps, where prices move faster and stories are more exciting. Comparing VNMidcap or VNSmallcap performance against VN30 therefore reveals the market’s internal rotation: mid/small outperformance signals risk-hungry retail phases; blue-chip outperformance signals institutional, foreign-led phases or defensive retreats. Sustained extremes in either direction have historically been more informative than the VN-Index level itself.
VNDiamond: the foreign-ownership-limit workaround
The VNDiamond index is a Vietnamese specialty that requires one piece of regulatory background. Vietnam caps foreign ownership in listed companies: 30% for banks (with a 2025 amendment, Decree 69/2025, allowing up to 49% in commercial banks that take over weaker banks under mandatory restructuring plans, provided the bank is not majority state-owned), while for other listed companies the ceiling varies by industry under Decree 155/2020 — 50% is a common cap in conditional sectors, and companies in unrestricted industries can in principle open up to 100%. In the most desired stocks, foreigners have bought every share they are legally allowed to hold; the stock is “full room” (room being the local term for the remaining foreign quota). A foreign fund that wants more simply cannot buy at the exchange price — full-room shares change hands between foreigners in negotiated deals at premiums above the listed price.
VNDiamond was engineered to bundle precisely these full-room, foreign-favorite stocks — the index holds between 10 and 20 constituents screened for market cap, liquidity and, critically, foreign ownership at or above 95% of the legal limit — into a basket that a domestic ETF could track. Foreign investors buy the ETF certificate — which, being a fund unit, is not itself subject to the same room limits — and thereby gain exposure to stocks they cannot buy directly. The tracking fund, the DCVFM VNDiamond ETF (ticker FUEVFVND), began trading on HOSE in April 2020 and became one of Vietnam’s most successful fund products on the back of this mechanism. For index readers, VNDiamond doubles as a sentiment gauge for exactly what foreign capital wants in Vietnam; its composition — heavy in the perennially full-room banks and retailers — is a live map of foreign appetite.
VNFIN Lead: the financial-sector concentrate
One more family member worth knowing is the VNFIN Lead index, which selects at least ten leading stocks from the VNAllshare Financials (VNFIN) sector universe with a 15% cap per constituent. Since financials are the market’s heaviest block, VNFIN Lead is effectively a leveraged expression of the sector view that already dominates the broad indices — and it, too, has its own tracking product, the SSIAM VNFIN Lead ETF (ticker FUESSVFL), which launched in February 2020. Watching VNFIN Lead against the VN30 shows you at a glance whether banks are leading or lagging the blue-chip complex.
HNX-Index and UPCoM-Index: the other venues
Each of the other two trading venues has its own composite index. The HNX-Index covers the Hanoi exchange’s smaller list, and the UPCoM-Index covers the unlisted-public-company market, home to everything from tiny firms to large state enterprises awaiting full listing. Both indices are structurally more volatile and less institutionally owned than HOSE benchmarks; their main analytical use is, again, as speculative-appetite thermometers. When UPCoM turnover explodes, retail risk-taking is running hot.
| Index | Coverage | Weighting | Best used for |
|---|---|---|---|
| VN-Index | All HOSE stocks | Full market cap, uncapped | Long-run market history; headline reference |
| VN30 | 30 largest liquid HOSE stocks | Free float; 10% stock / 15% group / 40% sector caps | Institutional benchmark; ETFs; futures |
| VNMidcap / VNSmallcap | Next 70 / smaller tier | Free float | Reading retail rotation and risk appetite |
| VNDiamond | Full-room foreign favorites (10–20 stocks) | Free float, capped | Foreign-demand exposure via ETF |
| VNFIN Lead | Leading financial stocks (≥10) | Free float, 15% cap | Concentrated bank/financial-sector exposure |
| HNX-Index / UPCoM-Index | Hanoi exchange / UPCoM board | Market cap | Speculative-segment thermometer |
Putting the benchmarks to work in your own investing
Everything above becomes practical through three specific uses.
Use the right benchmark for performance judgment. “Did I beat the market?” is meaningless until you name the market. If you hold Vietnamese blue chips, VN30 total return is your fair comparison; grading yourself against the plain VN-Index flatters you in dividend terms and distorts in weighting terms. If you hold mid caps, compare against VNMidcap. And always prefer total-return versions where available, because your account receives dividends even though the price indices do not. Measured honestly over a full year, a surprising share of active stock-picking underperforms the passive basket — knowing this is the beginning of realistic strategy design, whether you respond by indexing through ETFs or by concentrating your research effort where you have a genuine edge.
Use index products deliberately, not accidentally. Buying a VN30 ETF is a decision to own Vietnam’s credit-and-consumption giants at float weights; buying a Diamond ETF is a decision to own what foreigners want. Each is a reasonable core position with different personalities — the guide to choosing among Vietnam’s ETFs compares them in detail. What you should not do is hold an ETF while also holding its top constituents directly and then wonder why your “diversified” portfolio moves as one block: check overlap before layering.
Use index reading as context, not as a trading signal. The five-step daily routine — breadth, contribution, turnover, foreign flows, VN30-versus-VN-Index — will not tell you what to buy. It tells you what kind of market you are operating in: broad or narrow, institutional or speculative, convicted or drifting. Stock-level decisions still require stock-level work — reading financial statements, valuing businesses, weighing risks — which is a different craft with its own tools. If your English is stronger than your Vietnamese, that work has historically been the hard part in this market; it is the specific problem vwealth was built to solve, with AI-generated English research on Vietnamese listed companies. New investors can start with the fundamentals in our complete beginner’s roadmap to Vietnamese equities and the primer on the three Vietnamese trading venues.
Summary: two numbers, two different questions
The VN-Index and the VN30 answer different questions, and fluency in Vietnam’s market begins with keeping them apart. The VN-Index answers “what is the whole HOSE market worth relative to its past?” — a broad, full-cap-weighted, dividend-blind measure whose long chart is genuinely informative and whose daily prints are dominated by a handful of giants. The VN30 answers “how are Vietnam’s investable blue chips performing?” — a free-float, capped, rules-based basket that institutions can actually buy, that anchors the ETF and futures markets, and that filters out much of the periphery’s noise.
Read either one through its construction. Decompose daily moves into breadth, contribution and turnover before accepting any narrative. Respect the ±7% bands’ ability to disguise both the severity of crashes and the fragility of manias. Watch the gap between the blue-chip and small-cap tiers as a running poll of who is driving prices. And when the index tells you the market is interesting, do the company-level homework before acting — the benchmark is the map, never the territory.
This article is educational analysis for reference only and is not investment advice; always do your own research before making investment decisions.
Research Vietnamese stocks in English with vwealth. Our AI-powered platform turns Vietnamese market data into full English analysis reports — with international payment support and a free 2-month trial for new accounts. Create your free account and read the latest reports.