Vietnam GDP grew 8.02% in 2025 and 8.18% in the first half of 2026, with the National Assembly setting a target of at least 10% for the full year — among the fastest expansions of any economy of comparable size. But GDP growth and equity returns are not the same trade: in 2022 the economy also grew exactly 8.02% while the VN-Index fell roughly a third, and through late August 2026 the index was barely above where it closed 2025 despite another 8%-plus growth print. This guide sets out the verified numbers, what sits inside them, which parts of the listed market actually track which parts of GDP, and where the macro story can break.
Vietnam GDP right now: the numbers that are actually confirmed
Start with the primary source rather than the commentary. Vietnam’s national accounts are published by the National Statistics Office of Vietnam (NSO, formerly the General Statistics Office), which releases a quarterly socio-economic report within days of the quarter closing. That speed is unusual, and it is worth knowing that the first print is an estimate that gets revised.
2025: the strongest year in more than a decade
For the full year 2025, the NSO estimated GDP growth at 8.02%, the second-highest annual rate over the 2011–2025 period. The fourth quarter alone grew 8.46% year on year, the strongest Q4 in that same fifteen-year window. In current prices, the economy came in at 12,847.6 trillion dong, roughly 514 billion US dollars, with GDP per capita of about 5,026 dollars. Source: NSO, Socio-economic situation in the fourth quarter and 2025.
Two supporting numbers from the same release matter for equity investors. Export turnover reached 475.04 billion dollars (up 17.0%) against imports of 455.01 billion, for a goods trade surplus of 20.03 billion dollars. Disbursed foreign direct investment hit 27.62 billion dollars, up 9.0% and the highest in five years. Average CPI for the year was 3.31%, comfortably inside target — which is why the central bank was able to keep policy loose while growth ran hot.
2026 so far: a soft first quarter, then an acceleration
The 2026 story did not start smoothly. Q1 GDP growth came in at 7.83%, below expectations, with agriculture up 3.58%, industry and construction up 8.92% and services up 8.18% (NSO Q1 2026 report). Then the second quarter accelerated sharply to 8.39%, taking first-half growth to 8.18%, up from 7.63% in the same period of 2025.
The composition of that first half is where the interesting signal sits. According to the NSO press release on Q2 and H1 2026:
- Industry and construction grew 9.81% and contributed 47.20% of total value added growth, with manufacturing alone expanding an estimated 11.4%.
- Services grew 8.09%, contributing 47.14%.
- Agriculture, forestry and fishing grew 3.87%, contributing 5.66%.
- Exports reached 266.52 billion dollars (up 21.0%) but imports reached 283.17 billion (up 33.4%), producing a first-half goods trade deficit of 16.65 billion dollars.
- Disbursed FDI was 13.03 billion dollars, up 11.2%.
- Average CPI rose 4.38%, and retail sales grew 12.9%.
Read those last three lines together and you have the whole 2026 macro debate in miniature. Imports growing faster than exports is not automatically bad — much of it is machinery and inputs feeding capacity expansion — but it flips the current account cushion that has protected the dong for years. And CPI at 4.38% is materially higher than 2025’s 3.31%, sitting right at the government’s own 4.5% guideline. Fast growth is being bought with something.
The official target versus what outside forecasters expect
On 13 November 2025 the 15th National Assembly adopted the 2026 socio-economic development plan with a GDP growth target of 10% or higher, passed by 429 deputies, alongside a GDP per capita target of 5,400–5,500 dollars and average CPI of around 4.5% (Vietnam Government Portal).
Independent forecasters are considerably more conservative. The World Bank’s April 2026 East Asia and Pacific update projected Vietnam at 6.3% in 2026 and 7.7% in 2027 — still the highest in the region, but nearly four percentage points below the official goal.
Foreign investors should treat this gap as information rather than as a contradiction. Vietnam’s headline targets are policy instruments as much as forecasts: they signal how hard the state will push public investment, credit and administrative reform. A 10% target tells you the policy stance will be expansionary. It does not tell you the outcome. If you are building a base case, the sensible approach is to anchor on the multilateral forecasts and treat the official target as the ceiling of the plausible range.
What the GDP number is actually made of
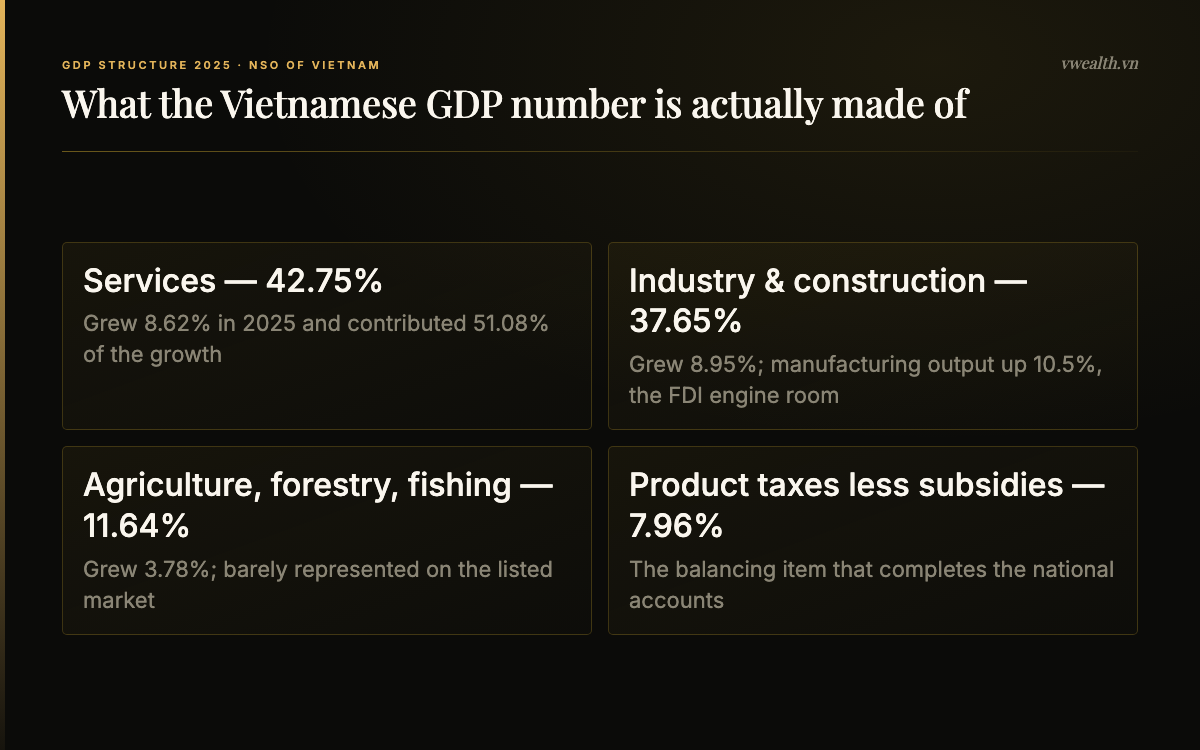
An 8% headline is useless until you know which 8%. Vietnam’s national accounts split output three ways, plus a balancing item.
The supply side: services lead on size, industry leads on momentum
In the 2025 structure published by the NSO, services accounted for 42.75% of GDP, industry and construction for 37.65%, agriculture, forestry and fishing for 11.64%, and product taxes less subsidies for 7.96%.
Services being the largest single block surprises people who think of Vietnam purely as a factory. The category covers wholesale and retail trade, transport and logistics, hospitality and tourism, finance and insurance, real estate services, telecoms and public administration. It grew 8.62% in 2025 and contributed a majority — 51.08% — of total growth that year.
Industry and construction is the volatile, headline-driving block. Manufacturing output rose 10.5% in 2025 and an estimated 11.4% in the first half of 2026. This is the part of the economy that responds fastest to global electronics cycles, to FDI project start-ups, and to tariff news. When people say Vietnam’s growth is export-led, this is the sector they mean.
Agriculture is the block that barely appears in your portfolio. It employs a large share of the workforce and stabilises rural incomes, but at 11.64% of output and 3.87% growth it neither drives the headline nor offers many investable listed vehicles.
The demand side: investment and trade are doing the heavy lifting
The NSO also publishes an expenditure decomposition, and for Q2 2026 it showed final consumption up 8.15%, gross capital formation up 15.2%, exports of goods and services up 20.18% and imports up 26.44%. Capital formation growing at nearly twice the rate of consumption tells you this is an investment-driven expansion — public infrastructure, industrial parks, power capacity and private capex — rather than a consumer boom.
That distinction matters for stock selection. An investment-led cycle favours construction materials, industrial property, power, logistics and the banks that finance them. A consumption-led cycle would favour retail, food and beverage, and consumer finance. Right now the data points to the former.
FDI: the engine that runs the manufacturing number
Vietnam’s manufacturing growth is not primarily domestic-company growth. Total newly registered FDI reached 38.42 billion dollars in 2025 with disbursed capital of 27.62 billion, and manufacturing and processing attracted the largest share of new registrations at 9.8 billion dollars, or 56.5% of the newly registered total (VnEconomy, citing the National Statistics Office).
Here is the point most macro-first investors miss, and it is the single most important idea in this article: the foreign-invested manufacturing sector that generates the bulk of Vietnam’s export growth is almost entirely absent from the VN-Index. The large electronics assemblers operating in Vietnam are subsidiaries of foreign parents listed in Seoul, Taipei or elsewhere. Their output flows into Vietnamese GDP and Vietnamese export statistics; their profits do not flow into Vietnamese listed equity. You can be completely right about Vietnamese manufacturing and own none of it through the local market.
Why GDP growth does not automatically become stock returns
The pitch you hear on Vietnam usually runs: fastest-growing economy in the region, young population, manufacturing relocation, therefore buy the index. The historical record does not support that as a mechanical relationship.
The four cases that break the correlation
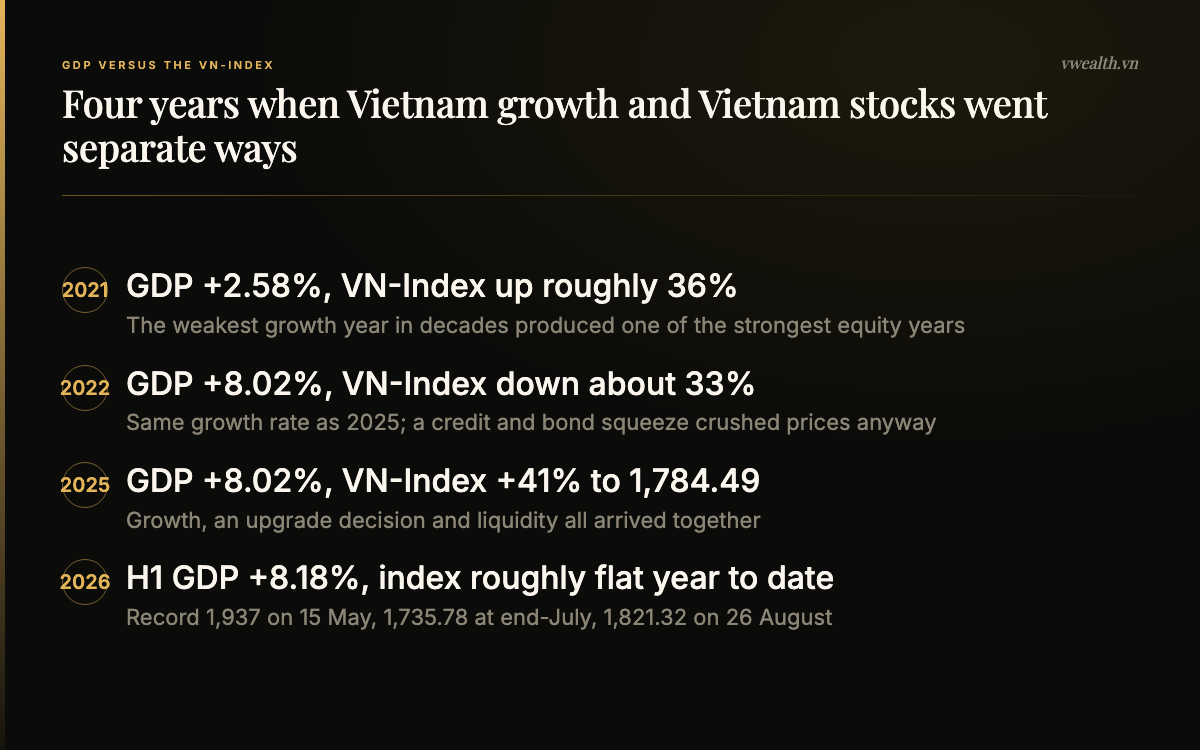
2021 — weakest growth, one of the strongest markets. GDP grew just 2.58%, among the lowest rates on record for Vietnam, as pandemic restrictions shut factories and cities (NSO 2021 release). The VN-Index rose roughly 36% that year, powered by a wave of new domestic retail accounts and rock-bottom deposit rates.
2022 — identical growth to 2025, opposite return. GDP grew 8.02%, matching 2025 exactly. The VN-Index closed the year down about a third, at 993.7 points on 27 December 2022, with total market capitalisation down 32.2% from end-2021. The NSO’s own commentary attributed the collapse to companies struggling to access loan capital, strict enforcement of credit growth limits, and a sharp contraction in corporate bond issuance. The economy was fine; the plumbing of finance was not.
2025 — everything lined up at once. GDP grew 8.02% and the VN-Index closed at 1,784.49 points, up approximately 41% on the year (VietnamPlus). But attributing that to GDP alone would be wrong: 2025 was also the year FTSE Russell’s upgrade path became credible, domestic liquidity was abundant, and rates were low.
2026 — growth accelerating, index going sideways. The VN-Index reached an all-time high of 1,937.00 on 15 May 2026 (Trading Economics), fell back to 1,735.78 by end-July (CEIC monthly series), and closed at 1,821.32 on 26 August 2026 — around 2% above the 2025 close, in a year when first-half GDP grew 8.18%.
Why the link breaks
Four mechanisms explain most of the divergence.
Liquidity beats growth over one-to-two year horizons. Vietnam’s market is dominated by domestic retail investors whose participation is highly sensitive to deposit rates and margin availability. When savings rates fall, money floods in; when credit tightens, it drains out regardless of what factories are producing. 2021 and 2022 are the clean experiment.
The listed market is not a scale model of the economy. As of data collected on 11 August 2026, real estate accounted for roughly 27% of total market capitalisation and banking for 26% — together about 53% of the market across 1,069 listed companies, according to KAFI Securities data reported by Vietnam.vn. Buying “Vietnam GDP” through the index means buying a property and credit cycle with a growth story attached.
Valuation is a separate variable. Nominal GDP growth raises the earnings base over time, but what you pay for those earnings moves on its own schedule, driven by rates, index inclusion flows and risk appetite. A market can grow into an expensive multiple for two years and deliver nothing.
Growth can accrue to labour, the state or foreign shareholders. Wage growth, tax take and foreign-owned factory profits are all GDP. None of them is necessarily earnings per share for a Vietnamese listed company.
What GDP growth does buy you
None of this means macro is irrelevant. Sustained 7–8% real growth with 3–4% inflation compounds nominal GDP at roughly 11–12% a year, and over five to ten years that is a powerful tailwind for corporate revenue. It also underwrites the structural story that draws foreign capital in the first place: rising per capita income, a deepening consumer class, and enough fiscal room to build infrastructure. Use GDP as the reason to have a strategic allocation to Vietnam. Do not use it to time entries.
Which parts of the listed market track which parts of GDP
If you want macro exposure with a real transmission mechanism, you have to map GDP components onto sectors deliberately. Before doing that, it helps to know how the market itself is structured — our guide to HOSE, HNX and UPCoM explains which exchange holds which kind of company, and the broader Vietnam stock market guide covers access, custody and trading mechanics.
Banks track nominal GDP and credit, not real GDP
Vietnamese banks are the most direct macro instrument in the market. Their loan books grow with the credit quota the State Bank of Vietnam allocates, and the SBV has guided toward system credit growth of around 15% in 2026, with credit growth already above 7.4% in the first half. Bank revenue is a toll on nominal activity, so it responds to nominal GDP — real growth plus inflation — rather than the real number alone.
The catch is that credit growth is a two-sided coin: it drives near-term earnings and builds the asset quality problem that shows up two years later. If you are going to hold Vietnamese banks as a GDP proxy, read our Vietnam banking sector guide first, because the metrics that matter here (price-to-book, NPL coverage, CASA) are not the ones you would use on an industrial.
Real estate and construction track investment, and amplify it
Gross capital formation growing 15.2% shows up in cement, steel, construction contractors and industrial park developers. Industrial property in particular is the cleanest listed proxy for the FDI story, because foreign manufacturers who cannot be bought directly still have to lease land from someone who is listed. The residential developers, by contrast, track the domestic credit and legal-approval cycle far more than they track GDP, which is why they were at the centre of the 2022 collapse.
Ports, logistics and industrials track exports
Export turnover of 266.52 billion dollars in the first half of 2026, up 21%, has to physically move. Port operators, shipping, warehousing and industrial services capture a fraction of that flow and are more reliably linked to trade volumes than to any domestic variable. They are also the sectors most directly exposed to tariff shocks.
Consumer and retail track household income, with a lag
Retail sales rose 12.9% in the first half of 2026 in nominal terms. Listed consumer names — retail chains, food and beverage, consumer finance — capture this, but with the caveat that modern trade is still taking share from traditional markets, so company-level growth can diverge sharply from the aggregate in both directions.
What you cannot buy locally
Worth restating: the foreign-invested electronics complex, the large multinational consumer companies operating in Vietnam, and much of the export manufacturing base are not on the local exchanges. If your thesis is specifically “supply chains are relocating to Vietnam,” the honest listed expressions are industrial property, ports, logistics, power and banks — not a broad index. For investors who would rather take the country exposure in a single wrapper, our comparison of the best Vietnam ETFs lays out what each fund actually holds, which is frequently not what its name implies.
The macro risks that can break the trajectory
Trade policy and tariffs: the largest single external risk
Vietnam runs one of the world’s largest bilateral goods surpluses with the United States, which makes it structurally exposed to US trade policy. The recent sequence is worth knowing because it is still unsettled:
- An initial reciprocal tariff rate of 46% was announced in April 2025 and subsequently reduced.
- In October 2025, the two governments announced a framework agreement locking Vietnam’s reciprocal rate at 20%, with transshipped goods facing 40% (Office of the US Trade Representative fact sheet).
- On 20 February 2026, the US Supreme Court ruled 6–3 that the President lacks authority to impose tariffs under the International Emergency Economic Powers Act, invalidating the reciprocal tariffs (Congressional Research Service). A temporary 10% surcharge under Section 122 of the Trade Act of 1974 followed from 24 February 2026.
- On 24 July 2026, USTR announced Section 301 measures covering 60 economies including Vietnam, following forced-labour enforcement investigations, resulting in a 12.5% additional tariff on most Vietnamese imports, with Section 232 metals tariffs applying separately (Vietnam Briefing).
Two lessons. First, the applicable rate has changed several times in eighteen months and will likely change again — verify the current rate before you model anything. Second, and more usefully, note that Vietnam’s exports to the US rose 28% in 2025 to 153.2 billion dollars even with the tariffs being in force for part of the year. Tariffs so far have compressed margins somewhere in the chain rather than stopping the volume. That will not necessarily hold at higher rates.
The currency
The dong has been managed lower in a controlled way for several years. Analysts surveyed for 2026 have forecast the dong weakening 4–5% against the dollar, driven by gold import demand and strong credit growth, while UOB projected USD/VND at 26,300 in Q1 2026 easing to 25,900 by Q4 (The Investor). For a foreign investor this is a direct haircut on returns: a 10% VN-Index gain with a 5% currency loss is a 5% dollar return. The first-half 2026 trade deficit of 16.65 billion dollars removes one of the historical supports for the currency and deserves monitoring.
Credit and the property cycle
Credit growth of around 15% against real GDP growth of 8% means credit is expanding faster than the economy — the mechanism that produced 2022. Watch three things: the SBV’s credit growth guidance and any mid-year adjustment, corporate bond maturities and issuance volumes in the property sector, and reported non-performing loan and coverage ratios at the listed banks. A credit accident does not need a growth slowdown to happen.
Inflation and the policy trade-off
Average CPI of 4.38% in the first half of 2026 versus 3.31% for all of 2025 narrows the room to keep policy loose. If inflation pushes through the 4.5% guideline, the central bank faces a choice between the growth target and price stability, and history suggests tightening arrives quickly when it arrives.
One risk that cuts the other way
FTSE Russell confirmed on 7 April 2026 that Vietnam’s reclassification from frontier to secondary emerging market takes effect 21 September 2026, with phased inclusion into 2027 and an initial weight of 0.22% in the FTSE Emerging Index. That is a flow event driven by index mechanics, not by GDP — and it is a good illustration of how much of Vietnam’s return can come from things the macro data will never tell you. We cover the mechanics and the realistic size of those flows in our note on the FTSE Russell market status upgrade.
Where to monitor Vietnam GDP data
Vietnam is unusually generous with data if you know where to look, and much of it is published in English.
Primary official sources
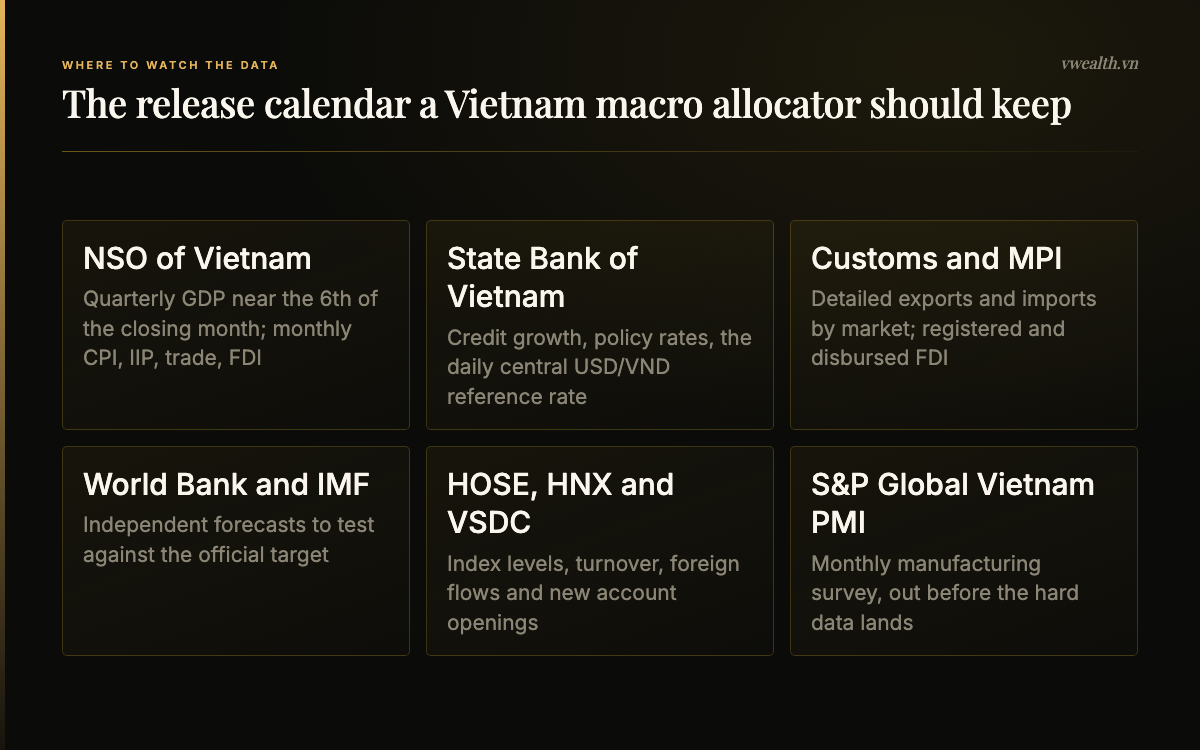
The National Statistics Office of Vietnam is the source of record. Its quarterly socio-economic report lands within about a week of the quarter end and contains GDP by sector, the expenditure decomposition, CPI, industrial production, retail sales, trade and FDI in one document. The State Bank of Vietnam publishes credit growth, policy rates and the daily central USD/VND reference rate. Customs data and Ministry of Finance releases give the detailed trade and investment breakdowns.
Independent cross-checks
The World Bank’s East Asia and Pacific Economic Update and the IMF’s Article IV consultations and World Economic Outlook provide forecasts built on different assumptions than the official plan. The monthly S&P Global Vietnam Manufacturing PMI is the best high-frequency read on the export sector, because it lands before the hard data and captures new orders.
Market-level data
Index levels, turnover and foreign net buying come from HOSE and HNX; the Vietnam Securities Depository and Clearing Corporation publishes new account openings, which is the cleanest available proxy for domestic retail participation — historically a better short-term predictor of index direction than any GDP release.
How to actually read a release
Three habits save a lot of grief. Compare like with like: Vietnamese quarterly GDP is normally reported year on year, not annualised quarter on quarter, so it is not directly comparable to a US print. Expect revisions, particularly to the first estimate of a quarter. And separate real from nominal — corporate revenue tracks nominal GDP, so an 8% real number with 4.4% inflation is closer to 12.5% nominal, which is the figure that matters for a company’s top line.
Using GDP in an actual allocation decision
Here is a practical sequence that respects everything above.
First, use GDP to size the strategic case, not the tactical one. If you believe Vietnam compounds nominal output at 11–12% for a decade, that justifies a standing allocation. Nothing in the quarterly print should change that allocation.
Second, decide which GDP component you actually want and buy that, rather than the index. Investment-led growth argues for industrial property, construction materials, power and logistics. Consumption catching up later argues for retail and consumer finance. A credit expansion argues for banks, with the asset-quality caveat attached.
Third, let liquidity and valuation drive timing. Deposit rates, margin balances, new account openings and the market’s forward multiple have historically explained more of the next twelve months’ return than the growth rate has.
Fourth, hedge or accept the currency explicitly. Do not discover a 5% dong depreciation after the fact.
Fifth, check what you already own. A generic emerging market fund will hold almost no Vietnam even after the FTSE upgrade phases in at a 0.22% weight. If you want the exposure, you have to take it deliberately.
Doing steps two and three properly means reading Vietnamese-language quarterly filings across dozens of companies to see which ones are actually capturing the macro you have identified. vwealth’s AI reads those original Vietnamese financial statements and produces full English analysis reports — five-year financial dashboards, sector context, valuation and peer comparison — updated as each quarter’s numbers land, so the framework in this article can be applied to individual names instead of stopping at the index.
Pulling it together
Vietnam’s macro record is genuinely one of the strongest in the world: 8.02% growth in 2025, 8.18% in the first half of 2026, manufacturing up double digits, FDI at a five-year high, and a government target of 10% or more for the full year. That is a real and durable reason to have Vietnam on your map.
But the honest version of the story includes 2022, when the same 8.02% growth rate accompanied a one-third decline in the index, and 2026 to date, when accelerating growth has produced roughly flat returns after a May peak. GDP tells you the size of the pond. It does not tell you which fish are listed, what they cost, or whether anyone is buying today. The listed market is a property and banking market with a growth economy behind it, the fastest-growing exporters are mostly foreign-owned and unlisted, and the swing factors over any one-year horizon are liquidity, credit, currency and index flows.
Keep the permanent framework — GDP composition, sector transmission, the divergence record, the risk list — and refresh the perishable numbers every quarter from the NSO directly rather than trusting any article, this one included.
Readers who prefer Vietnamese can find our companion analysis of the same subject here: Vietnamese version.
This article is analytical reference material, not investment advice; always do your own research and consider your personal risk tolerance before buying any security.
Research Vietnamese stocks in English with vwealth. Our AI-powered platform turns Vietnamese market data into full English analysis reports — with international payment support and a free 2-month trial for new accounts. Create your free account and read the latest reports.
Frequently Asked Questions
What is Vietnam’s GDP growth rate right now?
Vietnam’s economy grew 8.02% in 2025 and 8.18% in the first half of 2026, according to the National Statistics Office of Vietnam. The second quarter of 2026 alone grew 8.39% year on year, up from 7.83% in the first quarter. In current prices the 2025 economy was worth about 514 billion US dollars, with GDP per capita around 5,026 dollars.
What is Vietnam’s GDP target for 2026?
The National Assembly adopted a 2026 socio-economic development plan on 13 November 2025 setting a GDP growth target of 10% or higher, alongside GDP per capita of 5,400 to 5,500 US dollars and average CPI of around 4.5%. Independent forecasters are more conservative: the World Bank projected 6.3% growth for Vietnam in 2026 in its April 2026 East Asia and Pacific update, still the highest in the region.
Does high GDP growth mean Vietnamese stocks will rise?
No, not reliably. In 2022 Vietnam’s GDP grew 8.02%, exactly the same rate as 2025, yet the VN-Index fell about a third as credit tightened and corporate bond issuance collapsed. In 2021 growth was only 2.58% and the index rose roughly 36%. Over one to two year horizons, domestic liquidity, credit conditions, valuation and index flows have explained more of the return than the growth rate has.
What drives Vietnam’s GDP growth?
In the 2025 structure, services were 42.75% of GDP, industry and construction 37.65%, agriculture, forestry and fishing 11.64%, and product taxes less subsidies 7.96%. Manufacturing is the momentum driver, growing 10.5% in 2025 and an estimated 11.4% in the first half of 2026, funded largely by foreign direct investment: disbursed FDI reached 27.62 billion US dollars in 2025, a five-year high.
Which Vietnamese stock sectors track GDP most closely?
Banks track nominal GDP and the credit cycle, with the State Bank of Vietnam guiding system credit growth of around 15% for 2026. Industrial property, construction materials, power and logistics track the investment component, which grew 15.2% year on year in the second quarter of 2026. Retail and consumer names track household income. Crucially, the foreign-owned electronics exporters that generate much of Vietnam’s export growth are not listed in Vietnam at all.
What are the biggest risks to Vietnam’s economic growth?
US trade policy is the largest external risk: the applicable tariff regime has changed repeatedly since 2025, most recently a 12.5% Section 301 measure announced on 24 July 2026. Currency is the second risk, with analysts forecasting the dong weakening 4 to 5% against the dollar in 2026, which directly reduces foreign investor returns. Domestically, credit growing around 15% against 8% real growth, and average CPI of 4.38% in the first half of 2026 against a 4.5% guideline, both narrow the policy room.
Where can I find official Vietnam GDP data?
The National Statistics Office of Vietnam publishes a quarterly socio-economic report in English within about a week of each quarter closing, covering GDP by sector, the expenditure breakdown, CPI, industrial production, trade and FDI. The State Bank of Vietnam publishes credit growth and exchange rate data, while the World Bank and IMF provide independent forecasts. The monthly S&P Global Vietnam Manufacturing PMI is the best high-frequency read on the export sector.